Piecewise Functions
TLDRThe video script delves into the concept of piecewise functions, a type of graph with multiple equations for different parts of the domain. It illustrates how to graph and evaluate piecewise functions, including adding and multiplying them, and provides real-life examples like tax calculations. The script also covers breaking down absolute values and the greatest integer function, offering practical applications such as calculating mailing costs. The tutorial encourages viewers to practice graphing and evaluating on their own, enhancing understanding of these mathematical tools.
Takeaways
- 📈 Piecewise graphs are composed of multiple equations that define different parts of the domain, allowing for segmented representation of functions.
- 📚 The notes and homework for this topic are closely related to the piecewise function notes packet.
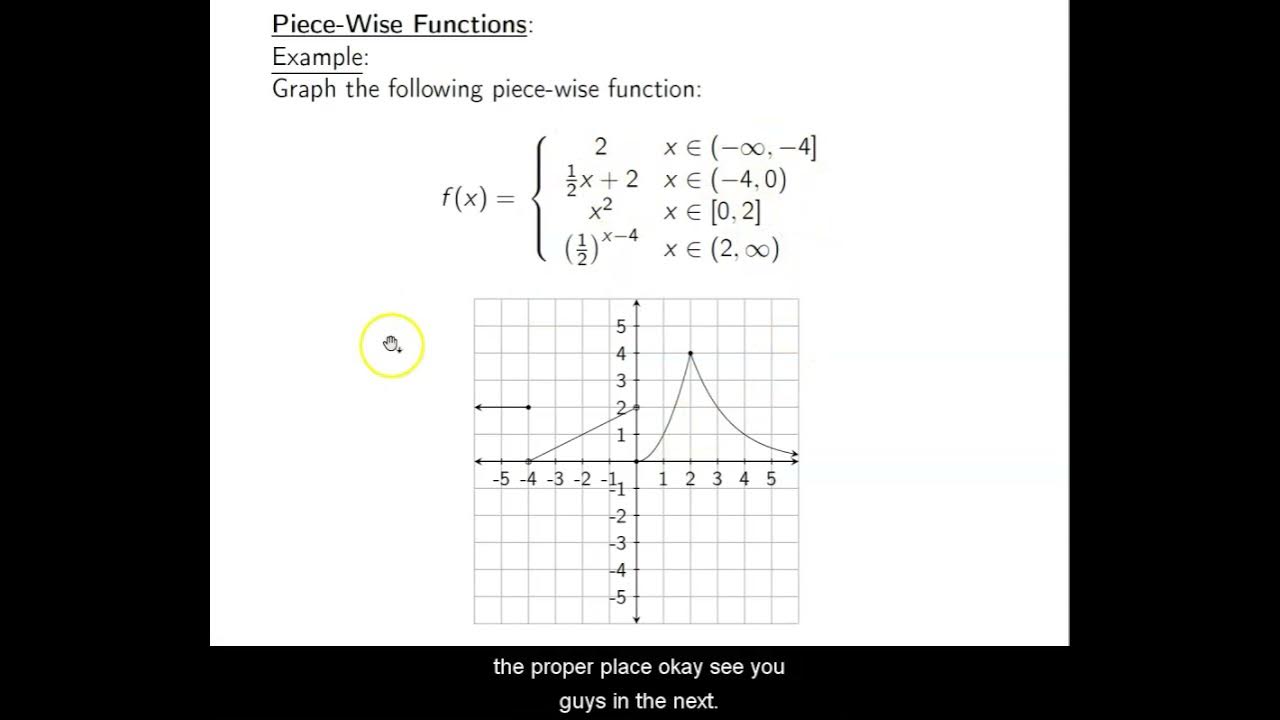
- 🚫 Restrictions are placed on the piecewise functions to define which parts of the graph are included, using open and closed dots to indicate inclusivity.
- 📉 The graphing process involves selecting the correct equation for each segment of the domain and plotting accordingly, with special attention to the restrictions.
- ✍️ When evaluating piecewise functions, one must determine which part of the domain the value falls into and then apply the corresponding equation.
- 🔢 Operations such as addition and multiplication of piecewise functions involve performing the operation section by section, respecting the domain boundaries.
- 📝 Graphing piecewise functions requires understanding the slope and y-intercept of each segment, as well as how to connect these segments within the domain.
- 📊 Real-life applications of piecewise functions include scenarios like taxation, where different rates apply to different income levels.
- 🧩 Breaking down absolute values into piecewise functions simplifies calculations and makes it easier to handle complex mathematical problems.
- 📦 The greatest integer function, which deals with rounding down to the nearest whole number, is an example of a piecewise function with clear domain partitions.
- 💰 Practical examples like the cost of mailing a letter, which increases in steps based on weight, can be modeled using piecewise functions to represent the different cost tiers.
Q & A
What is a piecewise graph?
-A piecewise graph is a type of graph that consists of different mathematical functions applied to different parts of the domain. It allows for the representation of complex relationships that cannot be described by a single function.
How is a piecewise function defined?
-A piecewise function is defined by different equations for different intervals or domains of the variable. Each segment of the function is defined by its own equation, and the overall function is created by combining these segments.
What does it mean for a graph to pass the vertical line test?
-A graph passes the vertical line test if any vertical line drawn on the graph intersects it at most at one point. This is a criterion that helps determine if a set of points represents a function.
How do you determine whether to use an open or closed dot on a piecewise graph?
-You use a closed dot on a piecewise graph when the endpoint of the interval is included in the domain of that segment's function (i.e., the value is equal to the endpoint). An open dot is used when the endpoint is not included (i.e., the value is strictly less than or greater than the endpoint).
What is the purpose of graphing a piecewise function?
-Graphing a piecewise function allows you to visualize and understand the behavior of a variable or function that changes its relationship or rule at different intervals or domains.
How do you evaluate a piecewise function at a specific point?
-To evaluate a piecewise function at a specific point, you first determine which interval the point falls into, and then apply the corresponding equation for that interval to find the function's value at that point.
What is a real-life example of a piecewise function?
-A real-life example of a piecewise function is the tax system, where different income levels are taxed at different rates. Lower incomes may be taxed at a lower rate, while higher incomes are taxed at a higher rate.
How can piecewise functions be used to break down absolute values?
-Piecewise functions can be used to break down absolute values by defining different equations for the function when the variable is less than zero and when it is greater than or equal to zero, effectively handling the 'V' shape of the absolute value graph.
What is the greatest integer function, and how is it used in piecewise functions?
-The greatest integer function, also known as the floor function, returns the largest integer less than or equal to a given number. It is used in piecewise functions to handle situations where the function's behavior changes at integer values, such as in cost calculations based on weight or distance.
How do you write the equation for a piecewise function based on a graph?
-To write the equation for a piecewise function from a graph, you identify the different segments and their corresponding equations based on their slopes and y-intercepts. You also define the domains for each segment, indicating where each equation applies.
Outlines
📈 Introduction to Piecewise Functions
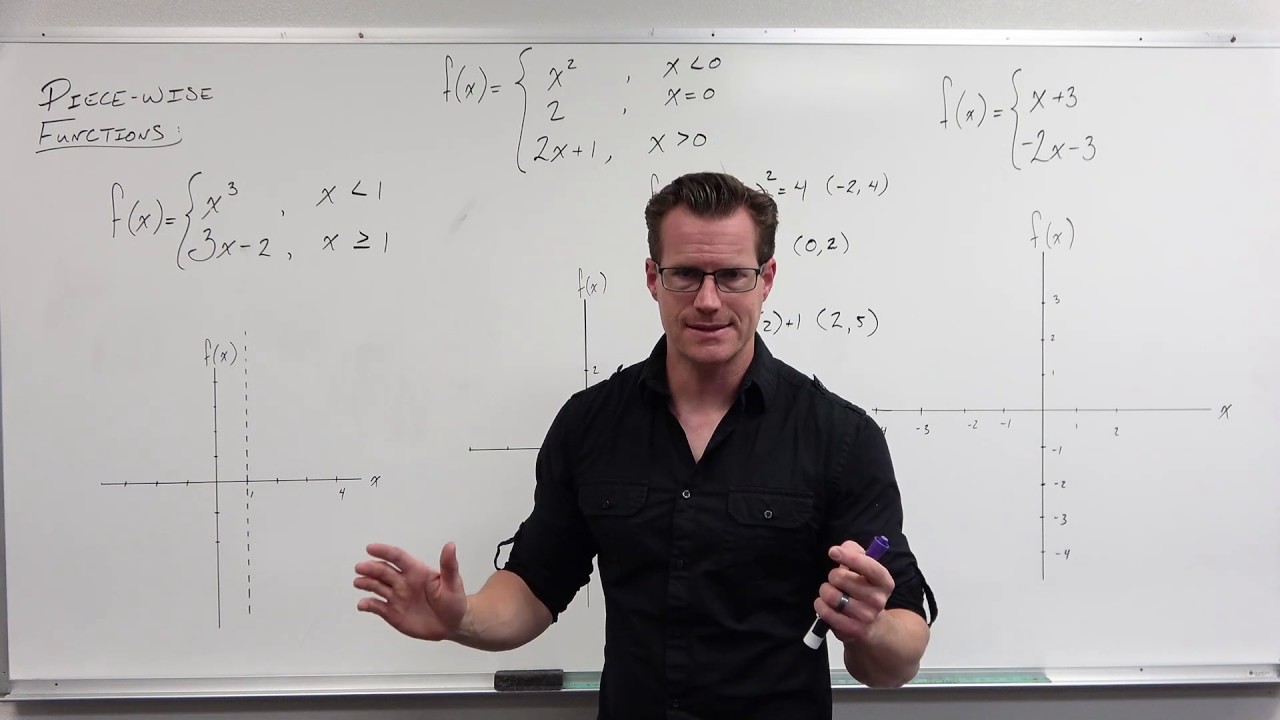
The video script introduces the concept of piecewise functions, a type of graph that consists of different equations for different parts of the domain. The instructor uses an example of a piecewise graph with three segments defined by different linear equations for x values less than zero, between zero and four, and greater than four. The graphing process is explained, including the use of open and closed dots to indicate the inclusivity of certain x values. The script also covers how to evaluate piecewise functions using both the equations and the graph.
🔍 Graphing and Evaluating Piecewise Functions
This paragraph delves deeper into the process of graphing piecewise functions, with the instructor encouraging viewers to attempt graphing on their own before revealing the correct method. The paragraph covers the graphing of a piecewise function defined by different equations for x values less than zero and greater than four. It also discusses the evaluation of the function at specific points, such as g(-0.2), g(0), g(4), and g(4.2), using both algebraic and graphical methods.
📚 Operations with Piecewise Functions
The script moves on to discuss operations that can be performed with piecewise functions, such as addition and multiplication. The instructor demonstrates how to add and multiply the segments of two piecewise functions, taking care to match the domains correctly. The process involves combining like terms and applying the operations section by section, resulting in new piecewise functions. The paragraph also includes the evaluation of a function at specific points, like f(2) and g(-3), to illustrate how to apply these operations.
📉 Writing Equations for Piecewise Graphs
The focus shifts to writing equations for given piecewise graphs. The instructor outlines the process of identifying the domains and corresponding equations for each segment of the graph. The paragraph provides a step-by-step guide on how to translate a visual representation of a piecewise function into its algebraic form, including handling different slopes and y-intercepts. The example given walks through the process of determining the equations for a graph with segments defined for x values less than negative one, between negative one and positive three, and greater than three.
💼 Real-life Application: Piecewise Functions in Tax Calculations
This paragraph explores a real-world application of piecewise functions in tax calculations, where different income levels are taxed at different rates. The script provides an example of how to calculate taxes based on income using piecewise functions, illustrating how to plug values into the correct equation based on the income bracket. The concept is reinforced with a sample calculation for different income levels, demonstrating the practical use of piecewise functions in everyday scenarios.
📊 Absolute Value Functions and the Greatest Integer Function
The final paragraph discusses the representation of absolute value functions and the greatest integer function as piecewise functions. The instructor explains how to break down the graph of an absolute value function into two distinct linear equations, one for x values less than zero and another for x values greater than zero. Additionally, the paragraph introduces the concept of the greatest integer function, which is used to model scenarios such as the cost of mailing a letter based on weight. The script concludes with an example of how to create a piecewise function to represent the cost structure, emphasizing the flexibility of piecewise functions to handle different scenarios.
Mindmap
Keywords
💡Piecewise Graph
💡Domain
💡Function
💡Graphing
💡Equation
💡Vertical Line Test
💡Slope
💡Y-Intercept
💡Evaluation
💡Real-life Example
💡Greatest Integer Function
💡Absolute Value
Highlights
Introduction to piecewise graphs, which consist of multiple equations for different parts of the domain.
Explanation of how to graph piecewise functions with different equations for various domain restrictions.
Demonstration of graphing a line with a restriction for x less than zero.
Illustration of graphing a horizontal line with a restriction from zero to four.
Method of graphing a line for x values greater than four.
Use of open and closed dots to indicate inclusivity or exclusivity of points on the graph.
Technique for evaluating piecewise functions using both the equation and the graph.
Guidance on graphing a piecewise function with multiple line segments.
Process of adding two piecewise functions by combining their respective segments.
Multiplication of piecewise functions by combining segments and using the distributive property.
Evaluation of piecewise functions at specific points using the appropriate equations.
Real-life example of piecewise functions using a tax system based on income levels.
Breaking down absolute values using piecewise functions to simplify calculus problems.
Graphing the greatest integer function and its application to the cost of mailing letters.
Creating a piecewise function to model the cost calculation for mailing letters based on weight.
Adjusting the piecewise function to correctly account for integer values in cost calculations.
Transcripts


5.0 / 5 (0 votes)
Thanks for rating: