Analyse data from experiments with completely randomised design (CRD)
TLDRThis educational video script delves into the concept of a completely randomized design (CRD) in experiments, contrasting it with a randomized complete block design. It explains the allocation of treatments at random without patterns, which is suitable for homogenous conditions but may fall short in heterogeneous scenarios. The script provides a step-by-step guide on analyzing data from CRD using an ANOVA table, illustrating the process manually, with Excel, and through SAS. It emphasizes the significance of comparing calculated F-values with tabulated ones to determine if treatments significantly differ, ultimately guiding viewers on how to reject or accept the null hypothesis based on their findings.
Takeaways
- 🔄 A completely randomized design (CRD) in experiments is where treatments are allocated randomly with no pattern, making it simple but potentially flawed in heterogeneous environments.
- 🧩 The script contrasts CRD with randomized complete block design (RCBD), which allocates treatments randomly within blocks, accounting for potential heterogeneity.
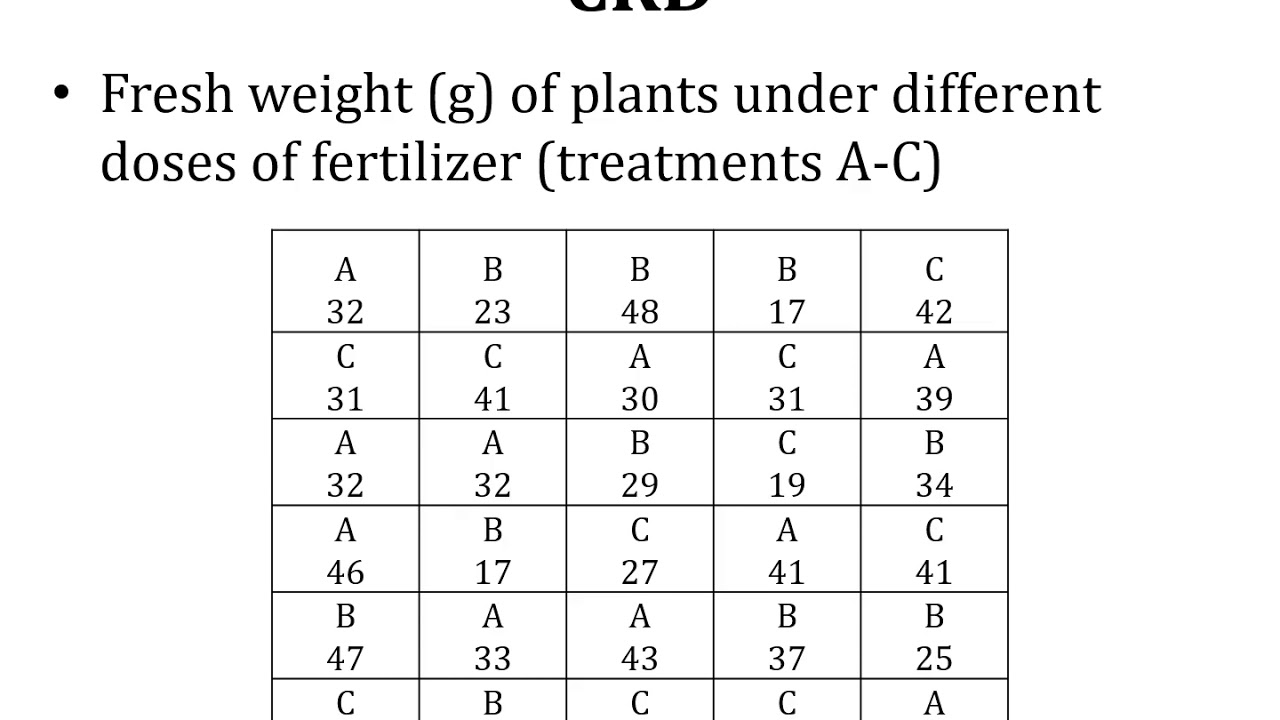
- 🌱 The video provides an example of a field experiment with 12 plots and 4 treatments (A, B, C, D) to illustrate the concept of CRD.
- ☀️ The choice between CRD and RCBD may depend on environmental factors, such as varying sunlight across different blocks of a field.
- 📊 The script introduces the ANOVA (Analysis of Variance) table for calculating the F-value, which is crucial for determining statistical significance in CRD experiments.
- 📘 The F-value is compared against a tabulated F-value to decide whether to reject or fail to reject the null hypothesis, indicating no difference between treatments.
- 📝 The presenter demonstrates how to manually calculate the ANOVA table using raw data from an experiment, including treatment totals, means, and sum of squares.
- 📊 The video explains how to use Excel for ANOVA calculations, including finding the F-value for a given confidence level and degrees of freedom.
- 💻 The presenter also shows how to perform ANOVA using SAS software, including data input, model specification, and interpretation of the output.
- 📈 The results from manual calculations, Excel, and SAS are compared to validate the consistency of ANOVA analysis across different methods.
- 🔍 The final part of the script discusses post-hoc tests, such as Tukey's HSD, to determine which specific treatments are significantly different from each other.
Q & A
What is a completely randomized design in the context of an experiment?
-A completely randomized design is an experimental layout where the replications of treatments are allocated at random, with no pattern in terms of blocks, rows, or columns. This design is easy to implement but may not be ideal if there are heterogeneities within the experimental units.
What are some potential shortcomings of a completely randomized design?
-Shortcomings of a completely randomized design include its inability to account for variations within the experimental units that could be due to factors like different blocks having varying sunlight exposure. If such heterogeneities exist, the design might not accurately reflect treatment effects.
What is the difference between a completely randomized design and a randomized complete block design?
-In a completely randomized design, treatments are allocated randomly without any pattern across the entire experimental area. In contrast, a randomized complete block design organizes treatments within blocks, ensuring that each block contains all treatments, and treatments are randomly allocated within each block.
How does the heterogeneity within blocks affect the choice of experimental design?
-If there is significant heterogeneity within blocks, such as varying sunlight exposure, a randomized complete block design might be more appropriate as it can account for these variations within blocks, thus providing a more accurate assessment of treatment effects.
What is an ANOVA table and what is its purpose in analyzing experimental data?
-An ANOVA (Analysis of Variance) table is used to calculate the F-value for an experiment. It helps determine whether there are significant differences between the means of different treatments, thus testing the null hypothesis that all treatments are the same.
How is the F-value used to test the null hypothesis in an ANOVA?
-The F-value calculated from the ANOVA is compared to a tabulated F-value from an F-distribution table. If the calculated F-value is greater than the tabulated value, the null hypothesis is rejected, indicating that there are significant differences between the treatments.
What is the significance of the p-value in the context of ANOVA?
-The p-value indicates the probability of observing the calculated F-value (or more extreme) if the null hypothesis were true. A p-value less than the chosen significance level (e.g., 0.05 for a 95% confidence interval) suggests that the differences between treatments are statistically significant.
How can one perform an ANOVA analysis using Excel?
-In Excel, one can perform an ANOVA analysis by using the 'Data Analysis' tool, selecting 'ANOVA: Single Factor', and inputting the appropriate data range. Excel will then calculate the ANOVA table, including the F-value and p-value.
What is the purpose of calculating the treatment sum of squares and the error sum of squares in an ANOVA?
-The treatment sum of squares measures the variance between treatment means, while the error sum of squares measures the variance within treatments. These values are used to calculate the F-value, which is crucial for determining if the differences between treatment means are statistically significant.
How does SAS software facilitate the analysis of experimental data using ANOVA?
-SAS software allows for the input of data and the application of statistical models, such as the general linear model, to perform ANOVA. It can automatically calculate the ANOVA table, including sums of squares, mean squares, F-values, and p-values, providing a comprehensive analysis of the experimental data.
What additional analysis can be performed in SAS to determine which treatments are significantly different from each other?
-After obtaining the ANOVA table in SAS, one can perform post-hoc tests, such as Tukey's Honest Significant Difference (HSD) test, to determine which specific treatments are significantly different from one another.
Outlines
🔬 Introduction to Completely Randomized Design
The speaker introduces the concept of a completely randomized design (CRD) in experimental setups, explaining that it involves randomly allocating treatment replications without any pattern. The script uses a field example with 12 plots and four treatments (A, B, C, D) to illustrate the absence of pattern in CRD, contrasting it with a randomized complete block design (RCBD) where treatments are allocated randomly within blocks. The speaker points out the limitations of CRD when there is heterogeneity between blocks and suggests considering the experimental conditions, such as sunlight variation, to choose the appropriate design. The paragraph concludes with an introduction to the ANOVA table used for data analysis in CRD.
📊 Calculating F-Value and ANOVA Analysis
This paragraph delves into the process of calculating the F-value using the ANOVA table for analyzing data from a completely randomized design. The speaker explains how to determine the tabulated F-value using Excel, considering the treatment degrees of freedom and the total degrees of freedom. The process includes calculating treatment totals, means, and the experimental total. The script discusses the calculation of the correction factor, total sum of squares, treatment sum of squares, and the error sum of squares. The F-value is then computed to test the null hypothesis, with a comparison to the tabulated F-value to decide whether to reject or fail to reject the hypothesis.
📈 Interpreting ANOVA Results and Hypothesis Testing
The speaker continues the discussion on ANOVA by interpreting the results of the calculated F-value against the tabulated F-value. If the calculated F-value exceeds the tabulated value, the null hypothesis, which assumes no difference between treatments, is rejected, indicating significant treatment differences. The script provides a step-by-step guide on filling out the ANOVA table with the correct values for degrees of freedom, sum of squares, and mean squares. The explanation includes the use of a formula to determine the F-value and the decision rule for hypothesis testing, emphasizing the importance of comparing the calculated F-value to the tabulated value.
📝 Performing ANOVA Using Excel
The paragraph demonstrates how to perform ANOVA analysis using Excel, starting with accessing the Data Analysis tool and selecting ANOVA: Single Factor. The speaker guides through specifying the input range, grouping by columns, and setting the alpha value for the confidence interval. The results from Excel, including degrees of freedom, sum of squares, F-value, and p-value, are compared with the manual calculations to validate the process. The script confirms that Excel's output matches the manual calculations, providing assurance of the analysis' accuracy.
🖥️ Conducting ANOVA in SAS and Post-Hoc Analysis
This section describes the process of conducting an ANOVA analysis using SAS, starting with data entry and proceeding to the general linear model procedure. The speaker details the steps to input data, specify the model, and run the analysis. The output from SAS, including the ANOVA table, F-value, and p-value, is discussed, indicating significant treatment differences. The script also addresses post-hoc analysis using Tukey's Honest Significant Difference (HSD) test to identify which treatments are significantly different from each other, based on their means and confidence intervals.
📢 Conclusion and Call to Action
In the concluding paragraph, the speaker summarizes the video's content on analyzing data from a completely randomized design using ANOVA, both manually and with the aid of Excel and SAS. The speaker invites viewers to subscribe to the channel and to leave comments or questions for further interaction. The call to action emphasizes the speaker's commitment to responding to viewer inquiries, encouraging engagement with the content.
Mindmap
Keywords
💡Completely Randomized Design
💡Replications
💡Treatments
💡ANOVA Table
💡F Value
💡Null Hypothesis
💡Degrees of Freedom
💡Tabulated F Value
💡Excel
💡SAS
💡Homogeneity
💡Randomized Complete Block Design
Highlights
Introduction to analyzing data from a completely randomized design experiment.
Explanation of what constitutes a completely randomized design.
Example of a field with 12 plots and 4 treatments (A, B, C, D) demonstrating a completely randomized design.
Comparison between completely randomized design and randomized complete block design.
Discussion on the suitability of completely randomized design in homogeneous vs. heterogeneous conditions.
Introduction to ANOVA (Analysis of Variance) table used to calculate F value.
Explanation of the null hypothesis and how F value determines its rejection or acceptance.
Step-by-step guide on manually calculating ANOVA table values.
Use of Excel to perform ANOVA calculations and compare results with manual calculations.
Introduction to SAS (Statistical Analysis System) for performing ANOVA.
Details on setting up data and coding for ANOVA in SAS.
Verification of SAS results against manual and Excel calculations.
Use of Tukey's test in SAS to determine which treatments are significantly different.
Visual representation of treatment differences using bar charts in SAS.
Conclusion emphasizing the importance of choosing the right design and analysis method for accurate results.
Transcripts
Browse More Related Video

Experimental Designs; Randomized Complete Block Design; RCBD; Two-Way ANOVA

Types of Experimental Research Designs - CRD RBD RCBD LSD FD - Research Methods - Practical Research
Experimental Designs; CRD; Completely Randomized Design; One-Way ANOVA
Lecture 18 Experimental Designs; Completely Randomized Design CRD; One Way ANOVA

ANOVA (Analysis of Variance) Analysis – FULLY EXPLAINED!!!

How to read F Distribution Table used in Analysis of Variance (ANOVA)
5.0 / 5 (0 votes)
Thanks for rating: