Complex Experiments: 3 - Main effects and interactions
TLDRThis script explores the complexities of factorial experiments, focusing on the main and interaction effects of independent variables on a dependent variable. It uses the example of treating depression with therapy and medication to illustrate how combining these variables can yield different outcomes than expected from their individual effects. The script also discusses the advantages of such experiments in creating more realistic and complex theories, while cautioning about the increased cost and difficulty in interpreting results with more variables.
Takeaways
- 🔍 Main effects in experiments can be positive, negative, or null, reflecting the impact of an independent variable on a dependent variable.
- 🌡 An example of a positive main effect is the effect of heat on aggression, where increasing the temperature can lead to more aggressive behavior.
- 🏠 A negative main effect can be seen in the number of outgroup friends reducing prejudice, indicating a decrease in the dependent variable with an increase in the independent variable.
- 🚫 A null effect, as seen in the Dare program's impact on drug use, shows no significant change in the dependent variable regardless of the independent variable's presence.
- 🤔 Interactions occur when the combined effect of multiple independent variables is not equal to the sum of their individual effects, indicating a more complex relationship.
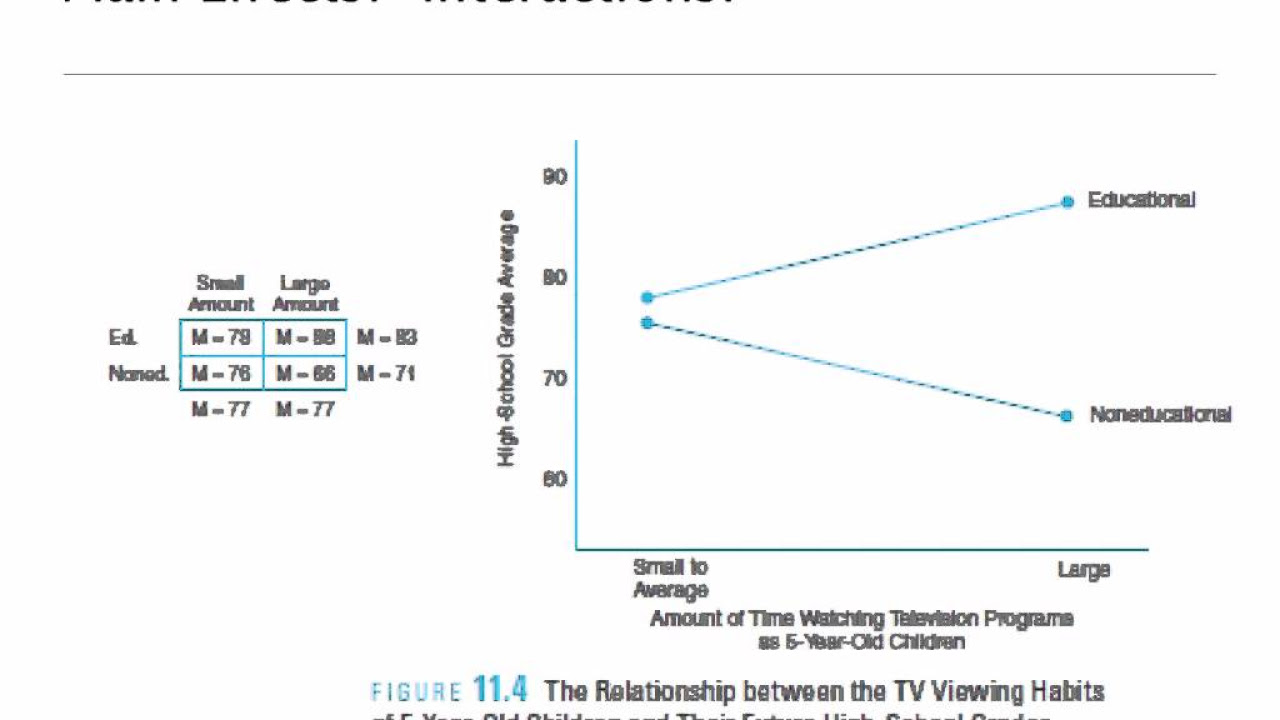
- 📊 Line graphs are a common way to represent data from experiments with multiple independent variables, allowing for visual analysis of effects and interactions.
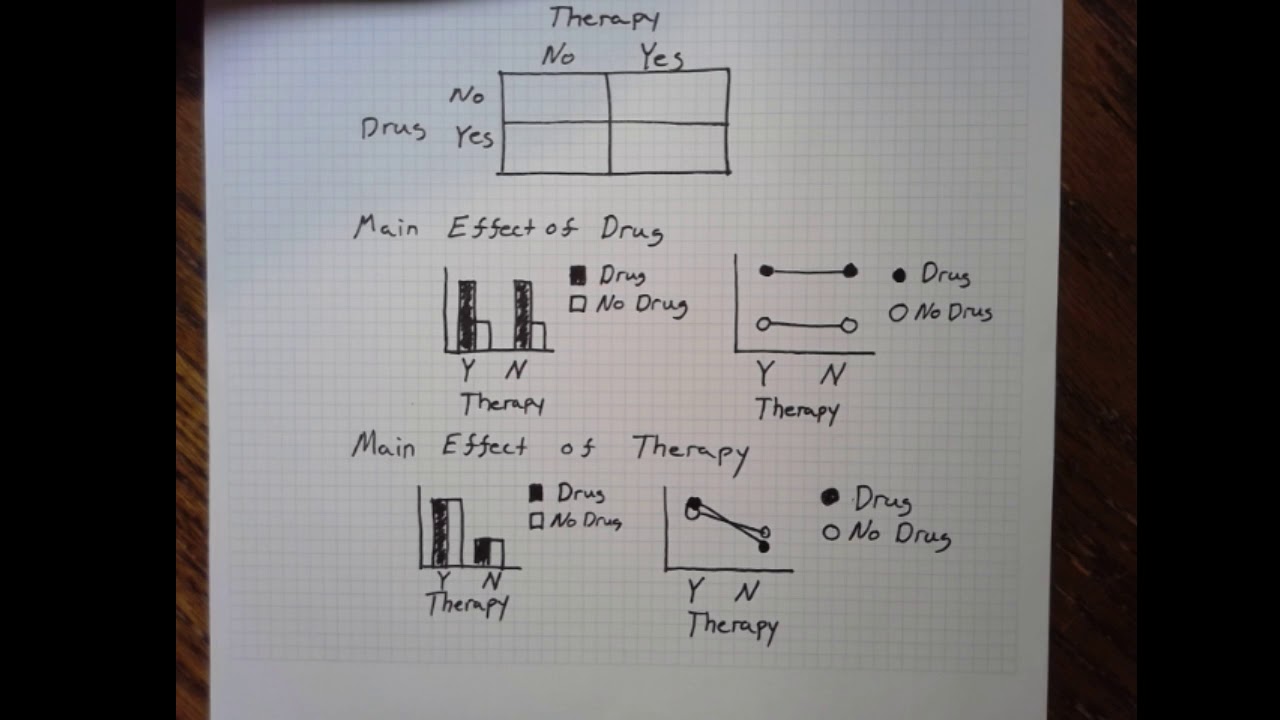
- 💊 In the context of treating depression, combining therapy and medication can yield different results than using each alone, highlighting the importance of studying interactions.
- 📈 Main effects are calculated by averaging across conditions to understand the overall impact of an independent variable on the dependent variable.
- 🔍 Between-cell effects compare the differences between individual conditions to understand the specific impact of combined independent variables.
- 📉 An antagonistic interaction occurs when the combination of conditions results in an effect opposite to what would be expected from the individual effects alone.
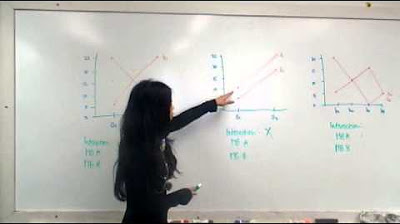
- 📈 The presence of an interaction can be visually identified in graphs by non-parallel lines, indicating a more complex relationship than simple addition of effects.
- 🧬 Experiments with multiple independent variables can better mimic real-life scenarios where multiple factors influence outcomes, though they can be more costly and complex to interpret.
Q & A
What are the three types of main effects discussed in the script?
-The three types of main effects are positive main effects, where increasing the strength of an independent variable increases the reaction of the dependent variable; negative main effects, where increasing the independent variable decreases the reaction of the dependent variable; and null effects, where there is no significant change in the dependent variable regardless of changes in the independent variable.
Can you provide an example of a positive main effect from the script?
-An example of a positive main effect given in the script is the effect of heat on aggression. It suggests that if a room is made hotter, people tend to act more aggressively.
What is an example of a negative main effect mentioned in the script?
-The script provides the example of outgroup friends and prejudice, indicating that the more outgroup friends a person has, the less prejudiced they tend to be.
What is an interaction in the context of the script?
-An interaction in the script's context refers to a situation where the combined effect of multiple conditions is not equal to the sum of their individual effects, resulting in a different outcome than what would be expected from simply adding the effects of each condition.
How is the effect of therapy and medication on depression described in the script?
-The script describes a scenario where individuals suffering from depression are treated with either therapy, medication, or both. It suggests that while both therapy and medication alone can reduce depression scores, the combination of both tends to yield the best effect, indicating a potential interaction.
What is the significance of graphing data with multiple independent variables?
-Graphing data with multiple independent variables, such as with a line graph, allows for the visualization of the effects of different combinations of variables on the dependent variable. It helps in identifying patterns, main effects, and interactions.
How does the script describe the process of identifying an interaction from a graph?
-The script explains that interactions can be identified from a graph by observing whether the lines representing different conditions are parallel. If the lines are not parallel, it suggests an interaction is occurring, with the nature of the interaction depending on the orientation of the lines.
What is an antagonistic interaction as described in the script?
-An antagonistic interaction, also referred to as a crossover interaction in the script, occurs when the lines representing the effects of different conditions are in completely different orientations, often crossing over each other on the graph, indicating a significant interaction effect.
Why might researchers choose to keep experiments relatively simple according to the script?
-Researchers might choose to keep experiments simple to avoid overextending resources, as adding more independent variables and levels increases the number of participants needed and can make the results more difficult to interpret.
What are the advantages of using factorial experiments as mentioned in the script?
-Factorial experiments allow for the uncovering of more complex relationships between variables. They can make experiments more realistic by accounting for multiple factors that might influence a dependent variable, and they enable the testing of more complex theories.
What is a potential downside of having too many levels in an experiment according to the script?
-A potential downside of having too many levels in an experiment is that it can make the data difficult to interpret. This complexity can arise from the need to represent the data in higher-dimensional graphs or animations, which can be challenging to understand and present.
Outlines
🔬 Understanding Main Effects and Interactions in Research
This paragraph introduces the concept of main effects in experimental research, explaining how an increase or decrease in an independent variable can positively or negatively affect a dependent variable, or have no effect at all. It uses examples such as the effect of heat on aggression and the influence of outgroup friends on prejudice. The paragraph also distinguishes between three types of main effects and introduces the idea of interactions, setting the stage for a deeper discussion on the topic with a hypothetical study on depression treatment involving therapy, medication, or both.
📊 Visualizing Interactions and Main Effects Through Graphs
The second paragraph delves into the visualization of interactions and main effects using line graphs. It describes how to plot data with multiple independent variables, using a study on depression treatment as an example. The paragraph explains how to interpret the graph by identifying different groups and understanding the combined effects of therapy and medication on depression scores. It also discusses how to determine if there is an interaction by comparing main effects with between-cell effects and highlights the importance of understanding these relationships in experimental design.
🤔 Examining the Presence and Absence of Interactions in Data
This paragraph explores the concept of interactions in more detail, using hypothetical results to illustrate different scenarios where interactions are present or absent. It explains how to identify interactions by comparing the main effects with the effects observed when combining conditions. The paragraph also discusses how to interpret results that show no interaction, where the combined effect of independent variables is simply the sum of their individual effects. It emphasizes the importance of understanding these dynamics for accurate data interpretation in research.
🌐 The Complexity of Real-World Factors in Experimentation
The fourth paragraph discusses the advantages and disadvantages of using multiple independent variables in experiments. It highlights the ability to create more realistic experiments that reflect the complexity of real-world situations, using personal examples of studies on dog ownership, political attitudes, and factors contributing to serial killers. The paragraph also addresses the challenges of increased cost and difficulty in interpreting results as the number of independent variables grows. It concludes by emphasizing the importance of balancing experimental complexity with the need for clear, interpretable results.
Mindmap
Keywords
💡Main Effects
💡Dependent Variable (DV)
💡Independent Variables
💡Interactions
💡Line Graph
💡Therapy
💡Medication
💡Factorial Experiments
💡Additive Effects
💡Antagonistic Interaction
💡Crossover Interaction
Highlights
Main effects can be positive, negative, or null, affecting the dependent variable's reaction to changes in independent variables.
Positive main effect example: increasing heat leads to increased aggression.
Negative main effect example: more outgroup friends reduce prejudice.
Null effect example: no impact of the Dare program on drug use found in controlled studies.
Interactions occur when combined conditions yield different effects than expected from individual main effects.
Study on depression treatment shows combined therapy and medication can have the best effect.
Line graphs are useful for representing multiple independent variables.
Different colored lines in graphs can represent different therapy groups.
Interaction can be identified by comparing main effects with between-cell effects.
Main effects and between-cell effects mismatch indicates an interaction.
Antagonistic interaction is characterized by lines in different orientations, possibly crossing over.
Experiments with multiple independent variables better match real-life complexities.
Factorial experiments can reveal surprising results from complex interactions.
Adding more independent variables increases experimental cost and participant numbers.
Complex experiments with many variables can lead to difficult data interpretation.
High-dimensional interactions may require advanced graphical representations like animations.
Factorial experiments are valuable for uncovering complex relationships between variables.
Transcripts


5.0 / 5 (0 votes)
Thanks for rating: