interaction main effect graphs
TLDRThis educational video script delves into the concept of interaction and main effects in statistical analysis, using graphical representation to illustrate key points. It clarifies that non-parallel lines suggest an interaction, where variables combine to influence the dependent variable uniquely. The script also explains how to identify main effects by analyzing the average impact of each independent variable separately, emphasizing that these effects do not necessarily indicate statistical significance without further testing. The video concludes with a humorous Halloween reference, adding a light-hearted touch to the educational content.
Takeaways
- 🌐 The assistant is capable of communicating in 187 languages, including their dialects and subsets.
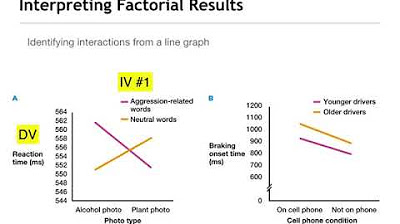
- 🔍 To determine if there is an interaction or main effect graphically, one should look at the parallelism of lines in a graph.
- ⚠️ A visual 'yes' or 'no' to interaction or main effects does not guarantee statistical significance; it only suggests the possibility.
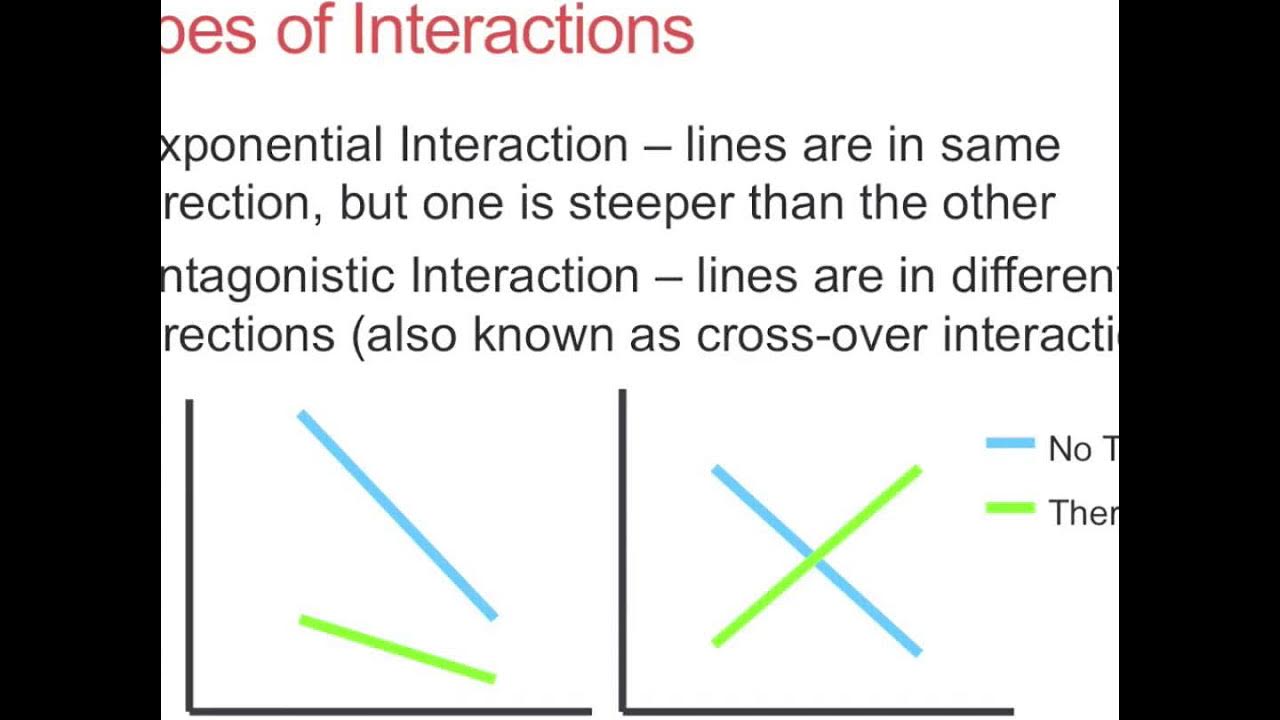
- 📈 Non-parallel lines suggest an interaction effect between independent variables A and B on the dependent variable (DV).
- 📉 Parallel lines indicate no interaction effect, meaning the independent variables do not combine to create a unique effect on the DV.
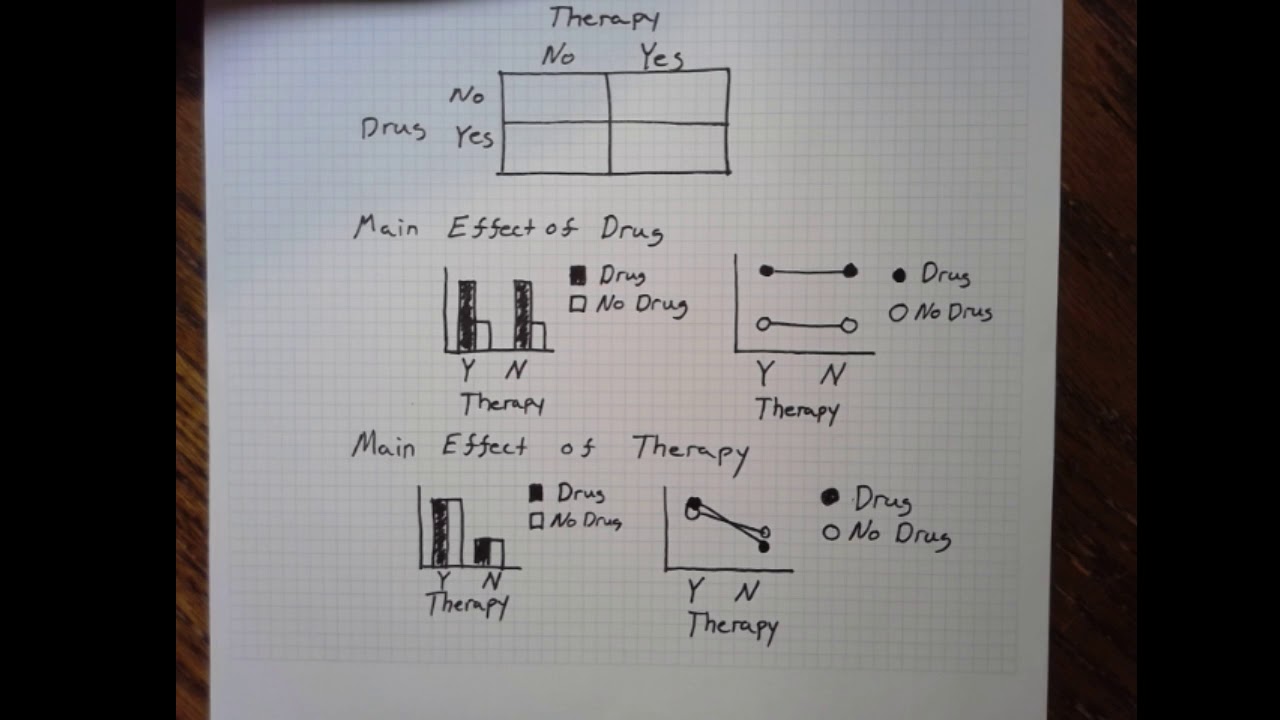
- 📊 For main effects, the analysis of marginal means involves assessing each independent variable separately to identify their individual impacts.
- 📝 To identify a main effect for variable A, compare the averages of data points associated with levels A1 and A2.
- 📈 For main effect B, compare the lines representing levels B1 and B2; if they are not the same, there may be a main effect B.
- 🔄 The position of A and B on the axes can vary, and it's important to track which variable is represented on the x-axis and which as lines.
- 🤔 The presence of an interaction or main effect is not confirmed until statistical testing is conducted, such as through manual calculations or software like SPSS.
- 🎃 The script ends humorously with a Halloween reference and an awkward cutoff, suggesting a lighthearted approach to the topic.
Q & A
What does it mean if the lines in a graph are not parallel when analyzing interaction or main effects?
-If the lines in a graph are not parallel, it suggests that there is an interaction between the independent variables A and B. This means that the variables are influencing the dependent variable in a combined way that would not be observed if each variable were considered separately.
How can you determine if there is a main effect for an independent variable?
-To determine if there is a main effect for an independent variable, you analyze the marginal means. For instance, for main effect A, you would look at the average of the data points associated with A1 and A2 separately. If these averages are different, there is a main effect for A.
What is the significance of the independent variables not affecting each other mathematically in the context of the script?
-The statement that the independent variables are not affecting each other mathematically means that variable A and variable B do not influence one another directly. Instead, they each have a separate effect on the dependent variable, which can combine to produce a different outcome than either would alone.
Can you have a main effect without an interaction effect in the same data set?
-Yes, it is possible to have a main effect without an interaction effect. A main effect occurs when an independent variable has an effect on the dependent variable regardless of the level of other independent variables. An interaction effect, on the other hand, occurs when the effect of one independent variable depends on the level of another independent variable.
How does the script define a significant interaction or main effect?
-The script explains that a significant interaction or main effect is not necessarily implied by the graphical analysis of parallel or non-parallel lines. It is just enough to suspect that there might be a significant effect, which would then need to be confirmed through statistical testing, either by hand or using software like SPSS.
What does it imply when the lines in a graph are parallel for the purpose of identifying an interaction effect?
-When the lines in a graph are parallel, it implies that the changes at one level of an independent variable are consistent across the levels of another independent variable. This suggests that there is no interaction effect, as there is no special combined effect produced by the interaction of the independent variables.
Why might a professor switch the positions of main effect A and B on a graph?
-A professor might switch the positions of main effect A and B on a graph to illustrate that the concepts of main effects are not tied to a specific axis or line orientation. This helps students understand that the focus should be on the relationship between the data points and the independent variables, regardless of their graphical representation.
How does the script suggest determining if there is a main effect for B when the lines are parallel?
-The script suggests that if the lines are parallel but one line is consistently higher or lower than the other, this indicates a main effect for B. The consistency in the difference between the lines suggests that the level of B has a systematic effect on the dependent variable.
What is the role of statistical testing in confirming the presence of an interaction or main effect?
-Statistical testing plays a crucial role in confirming the presence of an interaction or main effect. While graphical analysis can provide initial suspicions of these effects, statistical tests provide the evidence needed to determine if the effects are indeed significant and not due to random chance.
How does the script use humor to make the topic of interaction and main effects more approachable?
-The script uses humor by ending on an unexpected note, suggesting an awkward cutoff and a humorous Halloween reference. This light-hearted approach can make the topic feel less intimidating and more engaging for the audience.
Outlines
📊 Understanding Interactions and Main Effects in Data
This paragraph explains how to visually assess the presence of interactions or main effects in data by examining the parallelism of lines on a graph. It clarifies that non-parallel lines indicate an interaction between independent variables A and B, which jointly affect the dependent variable (DV) in a way that isn't simply additive. The speaker also discusses the concept of main effects, which is the independent influence of each variable on the DV. The paragraph emphasizes that the presence of these effects in a visual analysis only raises suspicion of significance, which must be confirmed through statistical testing. Examples are given to illustrate how to calculate the average of data points for assessing main effects.
🎃 Variability in Analyzing Main Effects and Interactions
The second paragraph continues the discussion on identifying interactions and main effects, but it introduces a twist by swapping the positions of variables on the axes to demonstrate that the analysis is not strictly tied to axis orientation. It advises viewers to be adaptable to such changes, as they may be used in different contexts or by professors for variety. The paragraph reiterates the method for detecting interactions by checking for non-parallel lines and confirms the presence of a main effect for variable A by comparing the average levels of A1 and A2. For variable B, it explains how to average the domains to assess its main effect, noting a downward trend that suggests a significant impact over time. The paragraph humorously concludes with an awkward ending, wishing a 'Happy Halloween' and implying the importance of adaptability in data analysis.
Mindmap
Keywords
💡Interaction
💡Main Effect
💡Dependent Variable (DV)
💡Independent Variables
💡Graphical Determination
💡Significance
💡Parallel Lines
💡Marginal Means
💡Synergistic Effect
💡Statistical Analysis
Highlights
The speaker offers to communicate in 187 languages and dialects besides English.
A method is introduced to visually determine interaction or main effects from a graph.
A 'yes' or 'no' to interaction/main effects doesn't confirm significance, only suspicion.
For interaction, non-parallel lines indicate variables A and B are influencing the dependent variable together.
Independent variables A and B affect the dependent variable differently when combined.
Main effect analysis involves examining the impact of each independent variable separately.
A lack of interaction is shown when lines are parallel, indicating no combined effect.
Main effect A is identified by averaging data points for each level of A.
If the averages for different levels of A are not the same, there is a main effect A.
Main effect B is determined by comparing lines representing different levels of B.
If lines representing B levels are not the same, there is a main effect B.
An example is given where lines are not parallel, suggesting a possible interaction.
The importance of averaging data points correctly to identify main effects is emphasized.
The transcript includes a humorous ending with an awkward cut and a Halloween reference.
The speaker reminds viewers that the position of main effects A and B can vary and should be carefully noted.
The video concludes with a reminder that visual analysis is preliminary and statistical testing is needed for confirmation.
Transcripts
Browse More Related Video
Factorial: Main Effects and Interaction Online 2
Factorial Designs: Main Effects & Interactions
Two factor ANOVA with repeated measures
Factorial Designs Describing Main Effects and Interactions
Complex Experiments: 3 - Main effects and interactions
Statistics 101: Two-way ANOVA with Replication, Marginal Means Graphs
5.0 / 5 (0 votes)
Thanks for rating: