Factorial Designs: Main Effects & Interactions
TLDRThis video delves into factorial designs, a method of experimentation involving multiple independent variables or 'factors.' It explains how these designs can reveal main effects and interactions between variables, using a 2x2 matrix example to illustrate. The script discusses how to interpret graphical data, identifying main effects through parallel lines and interactions through non-parallel ones, including condensing, fanning, and crossover interactions. A real-life study on encoding specificity further exemplifies these concepts, showcasing the complexity and insights of factorial designs.
Takeaways
- 🔍 Factorial designs are experiments with multiple independent variables, also known as factors, making them more complex to interpret as more variables are added.
- 📚 The term 'factorial' comes from the use of multiple factors in the design of the experiment.
- 🌟 A study by Grant et al. (1998) is used as an example to illustrate encoding specificity, showing the importance of context in learning and memory retrieval.
- 📈 Factorial designs can be represented in a matrix to visualize the different conditions created by varying independent variables.
- 🔢 The script introduces '2x2 factorial design' as an example, where '2' represents the number of levels for each independent variable.
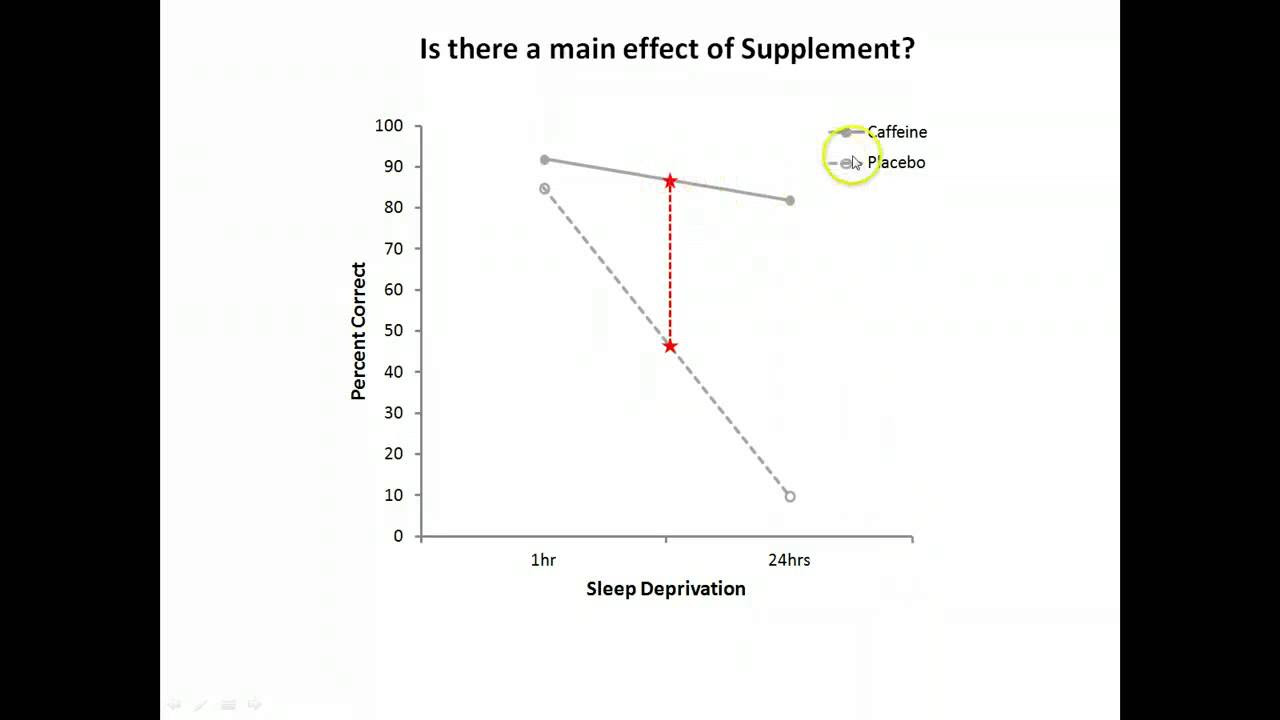
- 📊 Main effects in factorial designs refer to the impact of an independent variable by itself, while interactions refer to how variables work together.
- 💊 An example using drug and therapy treatments for depression is given to demonstrate how main effects and interactions can be visualized in a factorial design.
- 📊 Graphs and bar charts are useful for illustrating the differences in treatment efficacy under various conditions in a factorial design.
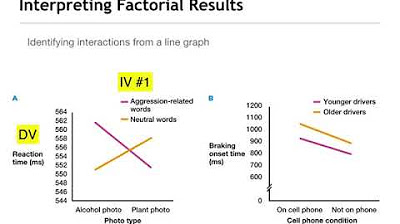
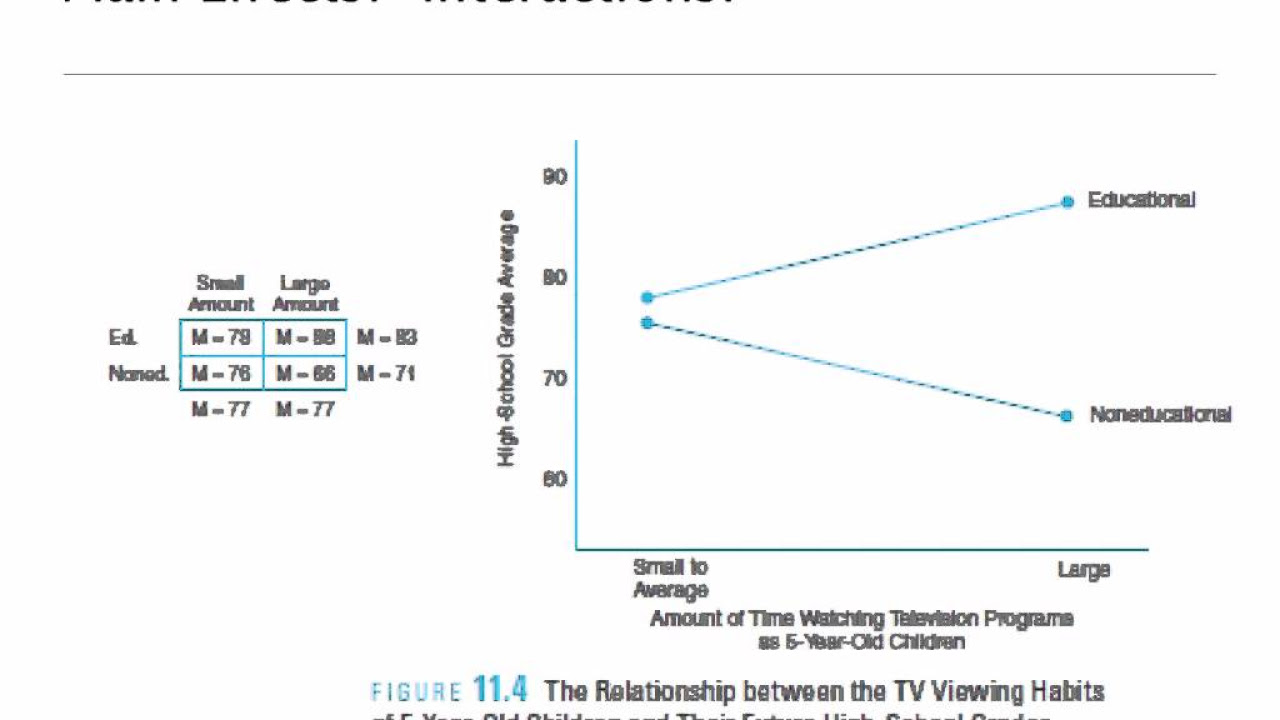
- 🤔 The presence of interactions can be identified by non-parallel lines in graphs, indicating that the effect of one variable changes depending on the level of another.
- 🔄 A crossover interaction is a specific type of interaction where the effects of the independent variables seem to 'cross over' each other on a graph, flipping their impact.
- 📝 The script concludes with the importance of identifying main effects and interactions from graphical representations in factorial designs.
Q & A
What are factorial designs in the context of experiments or studies?
-Factorial designs are a type of experiment or study that includes multiple independent variables, which are also known as factors. They allow researchers to examine the effects of these variables and their interactions on a dependent variable.
Why is it more challenging to interpret results as more independent variables are added in a factorial design?
-Adding more independent variables increases the complexity of the design, making it tougher to understand the results due to the higher number of potential interactions and main effects to consider.
What is the origin of the term 'factorial design'?
-The term 'factorial design' comes from the use of multiple factors, which are the independent variables in the study, and the fact that these variables are manipulated in the design.
Can you provide an example of a factorial design from the literature?
-An example from the literature is the study by Grant et al. from 1998, which demonstrated encoding specificity. The study had two independent variables: the study conditions (acquired or noisy environment) and the test conditions (quiet or noisy environments).
What is a 2x2 factorial design as mentioned in the script?
-A 2x2 factorial design is a specific type of factorial design with two independent variables, each having two levels. In the script's example, the two variables are study conditions and test conditions, both with two levels: quiet and noisy.
What are main effects and interactions in the context of factorial designs?
-Main effects refer to the impact of an independent variable on the dependent variable by itself. Interactions, on the other hand, refer to how the effect of one independent variable depends on or is contingent upon the level of another independent variable.
How can you visually represent factorial designs?
-Factorial designs can be visually represented using matrices or graphs. Matrices help in organizing the different conditions created by the levels of independent variables, while graphs can illustrate main effects and interactions through lines or bars.
What does a parallel line in a graph of a factorial design indicate?
-Parallel lines in a graph of a factorial design indicate that there are only main effects present, with no interactions between the independent variables.
What is a crossover interaction and how can it be identified in a graph?
-A crossover interaction is a type of interaction where the effect of one independent variable reverses depending on the level of another variable. It can be identified in a graph by the presence of a large 'X' shape, indicating that the lines are not parallel.
How can you determine if there is an interaction between independent variables in a factorial design?
-You can determine if there is an interaction by looking at the graph of the data. If the lines are not parallel, it suggests that there is an interaction between the independent variables. Different patterns of non-parallel lines can indicate different types of interactions.
What is the significance of identifying main effects and interactions in a factorial design?
-Identifying main effects and interactions is crucial for understanding the individual and combined impact of independent variables on the dependent variable. It helps in interpreting the results accurately and drawing meaningful conclusions from the study.
Outlines
🔍 Introduction to Factorial Designs
This paragraph introduces factorial designs as a type of experiment involving multiple independent variables, also known as factors. It explains the complexity of interpreting results as the number of factors increases. The script references a study by Grant et al., 1998, which demonstrated encoding specificity, using study and test conditions as independent variables in a 2x2 factorial design. The paragraph emphasizes the importance of diagramming factorial designs in a matrix to visualize different conditions and the concept of main effects and interactions, which are central to understanding factorial designs.
📊 Understanding Main Effects and Interactions
The second paragraph delves deeper into the concepts of main effects and interactions within factorial designs. It uses a hypothetical example of drug and therapy treatments for depression to illustrate how to represent these variables in a matrix and graph. The paragraph explains that main effects show the influence of a single variable, while interactions occur when the effect of one variable is contingent upon another. It also describes how to visually identify these effects through bar and line graphs, highlighting different scenarios where either the drug, therapy, or both have main effects without interaction, or when there is a significant interaction between them.
📚 Identifying Main Effects and Interactions in Graphs
The final paragraph focuses on how to identify main effects and interactions by analyzing graphs. It explains that parallel lines in a graph indicate main effects, while non-parallel lines suggest an interaction. The paragraph provides examples of different types of interactions, including condensing, fanning, and crossover interactions, and how they appear on a graph. It also revisits the Grant et al., 1998 study to demonstrate a crossover interaction with study and test conditions. The summary includes a step-by-step guide on how to draw and interpret graphs for a 2x2 factorial design, emphasizing the visual distinction between main effects and various types of interactions.
Mindmap
Keywords
💡Factorial designs
💡Independent variables
💡Main effects
💡Interactions
💡Encoding specificity
💡Matrix
💡Bar graph
💡Line graph
💡Crossover interaction
💡Condensing interaction
💡Fanning interaction
Highlights
Factorial designs involve multiple independent variables, making them complex to interpret.
The term 'factorial' comes from the use of multiple factors or independent variables in the design.
An example from Grant et al. (1998) demonstrates encoding specificity in learning contexts.
The study conditions and test environments are two independent variables in the Grant et al. study.
A 2x2 factorial design implies two independent variables with two levels each.
Main effects and interactions are two key aspects revealed by factorial designs.
Main effects show the impact of one independent variable on its own.
Interactions occur when the effect of one variable depends on the level of another.
A hypothetical example compares drug and therapy treatments for depression.
Diagrams and graphs are useful for visualizing the effects in factorial designs.
A bar graph can illustrate the efficacy of treatments with filled and open bars.
Line graphs can also represent treatment effects with different markers for conditions.
Identifying main effects involves looking for parallel lines in graphs.
Interactions are indicated by non-parallel lines in graphical representations.
A condensing interaction and a fanning interaction are types of interactions with non-parallel lines.
A crossover interaction results in an 'X' pattern on a line graph, indicating flipped effects.
The Grant et al. study showed a crossover interaction between study and test conditions.
Identifying main effects and interactions is crucial for understanding factorial designs.
Transcripts
Browse More Related Video
Factorial Designs Describing Main Effects and Interactions
Factorial: Main Effects and Interaction Online 2

Two-Factor Factorial Design Experiments - ANOVA Model

2^k Factorial Designs Experiment - ANOVA Model
Main effects & interactions

Full Factorial Design (DoE - Design of Experiments) Simply explained
5.0 / 5 (0 votes)
Thanks for rating: