Statistics 101: Two-way ANOVA with Replication, Marginal Means Graphs
TLDRThis video script delves into the intricacies of two-factor ANOVA, exploring various outcomes of significance through hypothetical examples. It explains how to interpret interaction graphs by examining column and row effects, and the implications of significant interactions on main effects analysis. The script uses plant food and feeding frequency as examples, illustrating how graphical models can provide insights into data before statistical software analysis, emphasizing the importance of visual tools in understanding ANOVA results.
Takeaways
- 📊 Two-factor ANOVA is used to analyze the significance of the effects of two factors and their interaction on a dependent variable.
- 🔍 There are five possible outcomes in terms of significance for Factor A, Factor B, and their interaction, including all possible combinations of significance and non-significance.
- 👉 When interaction is significant, individual factors cannot be analyzed separately because they are intertwined and confounded.
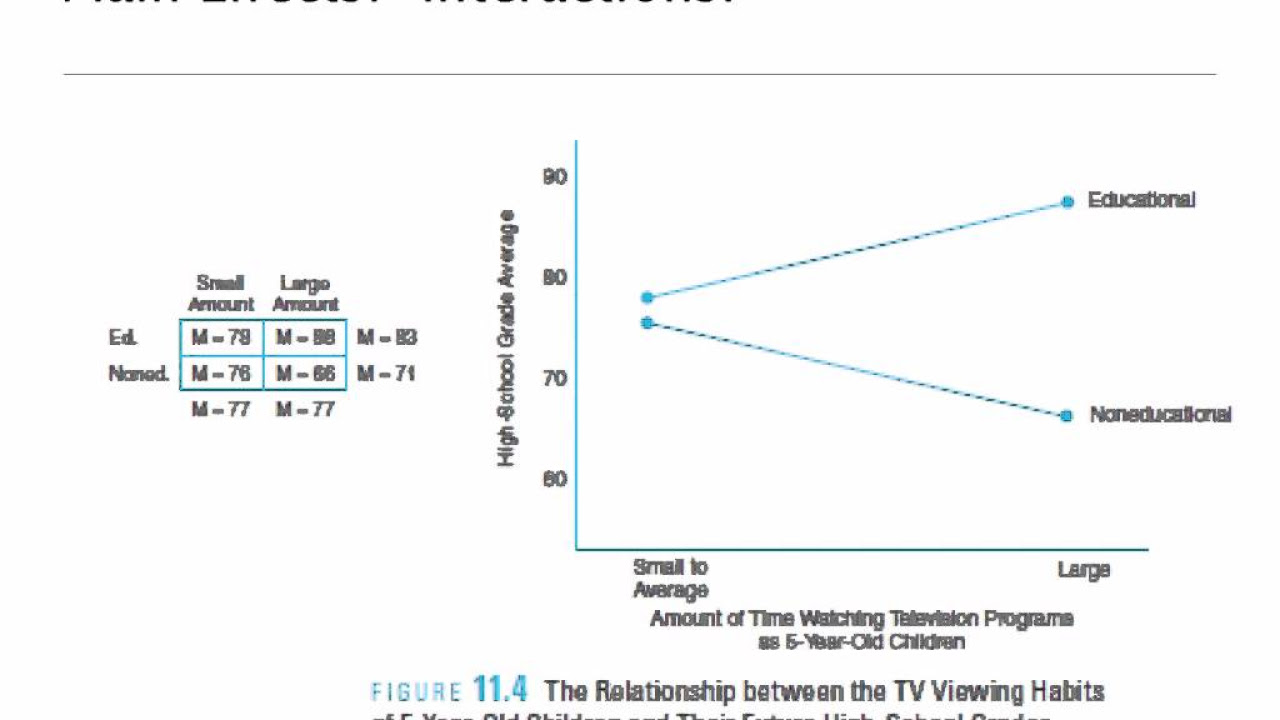
- 📈 Interaction graphs help visualize the relationship between cell means, column means, row means, and the overall mean.
- 🔑 Column effects are assessed by looking at whether the lines in the graph are increasing, decreasing, or flat, indicating the effect of different levels of one factor.
- 🔍 Row effects are determined by the distance between lines, which indicates the impact of different levels of the second factor.
- 🚫 If lines in the interaction graph cross, it suggests a significant interaction, and further analysis of main effects is not conducted.
- 📝 Hypothetical data examples are used to demonstrate how interaction graphs are constructed and interpreted.
- 📉 The significance of main effects and interaction is confirmed through statistical analysis, such as ANOVA, and not just by visual inspection of the graph.
- ⚠️ Even if main effects are significant, it does not imply that there is a significant interaction; they are separate concepts.
- 📚 Understanding interaction graphs is crucial for interpreting ANOVA results and determining the significance of factors and their interactions in research.
Q & A
What is the main topic of the video script?
-The main topic of the video script is the explanation of two-factor ANOVA and the interpretation of interaction graphs in the context of statistical analysis.
What are the two factors considered in the script for the two-factor ANOVA example?
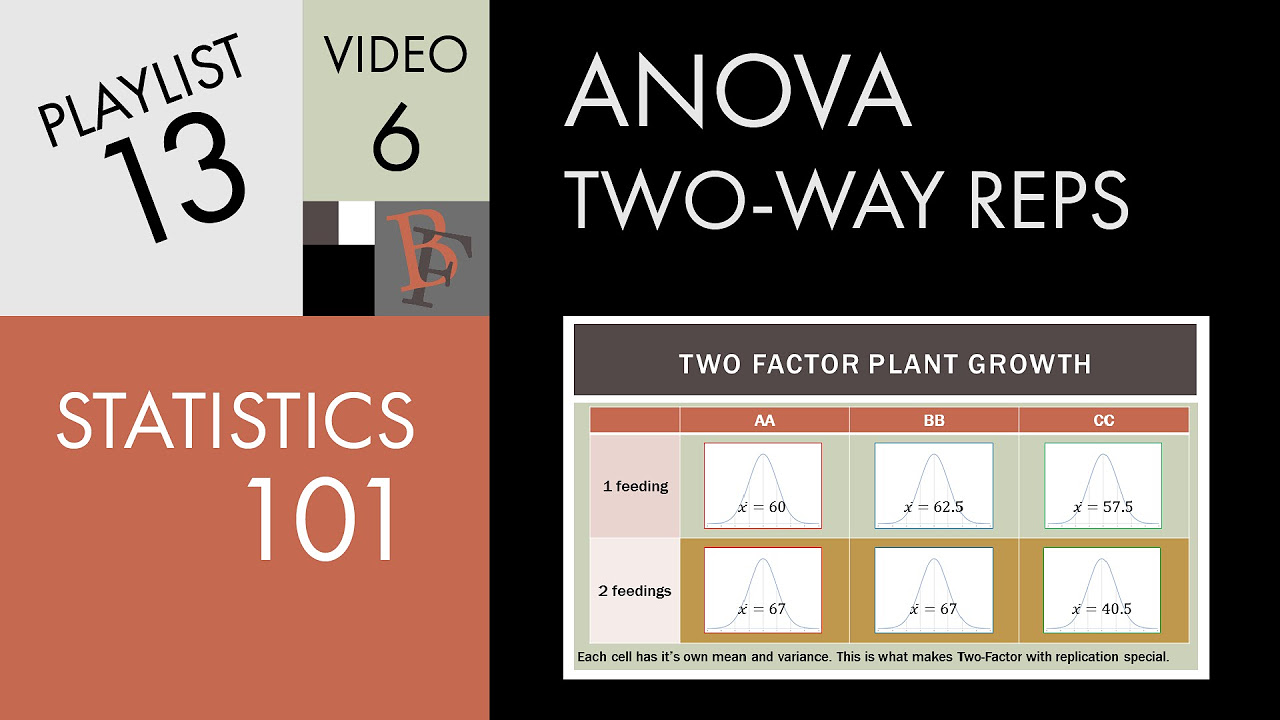
-The two factors considered in the script are Factor A, which is the type of food, and Factor B, which is the feeding frequency, with one or two times per day as the levels.
What is the significance of the interaction term in ANOVA?
-The interaction term in ANOVA is significant when there is a mutual influence between the two factors. If the interaction is significant, the individual factors cannot be analyzed separately because they are intertwined.
How are the column effects represented in an interaction graph?
-In an interaction graph, the column effects are represented by the lines. The direction of the lines (increasing, decreasing, or flat) indicates whether there is an effect due to the column factor.
How can the significance of row effects be determined from an interaction graph?
-The significance of row effects can be determined by observing the distance between the lines in an interaction graph. If the lines are far apart, it suggests that the row factor, such as feeding frequency, is significant.
What does it mean if the lines in an interaction graph do not cross?
-If the lines in an interaction graph do not cross, it indicates that there is no significant interaction between the factors. Each factor can be considered independently of the other.
How does the script use hypothetical data to illustrate the interpretation of interaction graphs?
-The script provides several scenarios with hypothetical data, plotting the growth of plants under different food types and feeding frequencies. It then discusses how the patterns in the data, such as flat lines or lines that are far apart, can be interpreted in the context of the interaction graph.
What is the purpose of plotting cell means on an interaction graph?
-Plotting cell means on an interaction graph helps to visually analyze the effects of different factors and their interactions on the response variable. It allows for a quick assessment of the significance of main effects and interactions.
How does the script discuss the importance of considering the overall mean in the analysis?
-The script emphasizes the importance of considering the overall mean by comparing the distances of column and row means from it. It explains that the further away the means are from the overall mean, the more likely they are to be significant.
What is the conclusion the script draws about the relationship between visual patterns in interaction graphs and statistical significance?
-The script concludes that visual patterns in interaction graphs, such as the distance of means from the overall mean and the crossing of lines, can provide insights into the statistical significance of factors and their interactions before running the data through statistical software.
Outlines
📊 Understanding Two-Factor ANOVA Outcomes
This paragraph introduces the concept of two-factor ANOVA and outlines the potential outcomes in terms of significance. The factors discussed are 'food' and 'feeding frequency', with 'interaction' as the third element. Five scenarios are presented, ranging from none of the factors being significant to all being significant, with a focus on the importance of analyzing interactions first due to their confounding effect on individual factor analysis.
🌱 Analyzing Plant Growth Data with ANOVA
The script delves into the analysis of hypothetical plant growth data using ANOVA. It explains how to interpret the significance of factors and interactions through graphical representations. The importance of observing whether lines in the graph are flat, increasing, or decreasing is emphasized to determine the effect of plant food. Additionally, the distance between lines indicates the impact of feeding frequency. The paragraph uses specific data points to illustrate how to construct and interpret interaction graphs.
📈 Interpreting Interaction Graphs for Significance
This section discusses the interpretation of interaction graphs, emphasizing the significance of lines crossing as an indicator of a significant interaction. It uses a series of hypothetical datasets to demonstrate how lines that do not cross suggest no interaction, while crossed lines indicate a significant interaction. The paragraph also touches on practical implications, such as choosing the most effective plant food and feeding frequency based on the data.
📉 Estimating Marginal Means with SPSS Graphs
The paragraph explains how to use SPSS to create and interpret estimated marginal means graphs. It provides a step-by-step guide on color-coding and analyzing the data points for different types of stores and competitor scenarios. The importance of comparing the means of different groups to the overall mean is highlighted, along with the significance of the interaction term in the analysis.
📝 Analyzing Shoe Store Sales Data
This section uses a dataset of shoe store sales to illustrate the application of ANOVA. It describes how to examine the impact of the number of competitors and store type on sales using an interaction graph. The paragraph explains how to interpret the graph by comparing the means of different groups to the overall mean and determining the significance of the factors and interaction.
📚 Summarizing ANOVA Analysis with Graphs
The final paragraph summarizes the importance of interaction graphs in ANOVA analysis. It reiterates how these graphs can visually represent the relationships between cell means, column means, row means, and the overall mean. The paragraph concludes by emphasizing the utility of these visual tools in understanding data before statistical analysis and the limitations when dealing with multiple levels in variables.
Mindmap
Keywords
💡Two-factor ANOVA
💡Significance
💡Interaction
💡Column effects
💡Row effects
💡Cell means
💡Hypothetical data
💡Marginal means
💡Significance level
💡F-value
💡Estimates of effect size
Highlights
Introduction to two-factor ANOVA and its possible significance outcomes.
Explanation of Factor A (food), Factor B (feeding frequency), and their interaction (Factor AB).
Technical analysis direction: right to left for significance evaluation.
Significance of interaction over individual factors when interaction is significant.
Visual representation of interaction graphs with column and row effects.
Interpretation of column effects based on line trends in the graph.
Interpretation of row effects based on the distance between lines in the graph.
Hypothetical data example to demonstrate interaction graph construction.
Analysis of plant growth data to illustrate the significance of main effects and interaction.
Practical implications of feeding frequency and plant food choice based on graph analysis.
Different hypothetical data sets to explore various outcomes in ANOVA.
Importance of considering interaction before main effects in ANOVA.
Use of SPSS for estimating marginal means and visualizing data.
Correlation between SPSS output and visual data representation.
Significance of interaction term in SPSS output and its impact on further analysis.
Visual tool of marginal means for understanding data before statistical analysis.
Summary of how interaction graphs help interpret complex ANOVA data.
Closing remarks emphasizing the utility of visual analysis in understanding ANOVA.
Transcripts


5.0 / 5 (0 votes)
Thanks for rating: