Using the F-Distribution Tables in Statistics
TLDRThis video script offers a detailed tutorial on understanding the F-distribution and its tables, crucial for hypothesis testing in statistics. It explains the skewed nature of the F-distribution, how to identify the critical value (F sub alpha) corresponding to a given level of significance (alpha), and the importance of degrees of freedom in selecting the correct table. The script guides viewers through examples of finding F sub alpha for different alpha levels and sample sizes, emphasizing the necessity of matching the table to the problem's specific alpha and degrees of freedom.
Takeaways
- 📚 The script discusses the F-distribution and its use in hypothesis testing, particularly in determining critical values for statistical significance.
- 📉 The F-distribution is characterized by being skewed to the right and extending to infinity, with values starting from zero.
- 🔍 To find critical values, one must use F-distribution tables, which are organized by the level of significance (alpha) and degrees of freedom.
- 🎯 The critical value, F sub alpha, is the value from the F-distribution table that corresponds to the area to the right under the curve, representing the level of significance.
- 📈 Common levels of significance (alpha) used in hypothesis testing are 0.01, 0.05, and 0.10, which correspond to 99%, 95%, and 90% confidence levels, respectively.
- 🔢 The degrees of freedom for the F-distribution are determined by the number of samples minus one for both the numerator and the denominator.
- 📝 The script emphasizes the importance of selecting the correct table based on the level of significance and having the correct degrees of freedom for both populations.
- 📑 F-distribution tables provided in textbooks may be split into multiple pages, each catering to different ranges of degrees of freedom.
- 🤔 The script suggests that understanding the F-distribution and its tables is crucial for correctly performing hypothesis tests and determining the rejection region.
- 📚 The video script includes examples and exercises to illustrate how to read and interpret values from the F-distribution tables.
- 🔑 The critical value found from the F-distribution table is essential in hypothesis testing as it sets the threshold for deciding whether to reject or fail to reject the null hypothesis.
Q & A
What is the F distribution in the context of statistics?
-The F distribution is a type of statistical distribution that is used in hypothesis testing, particularly when comparing two variances. It is characterized by its skewed shape, with values starting from zero and extending to infinity.
Why are there multiple tables for the F distribution?
-There are multiple tables for the F distribution because it is not a single distribution but a family of related distributions, each defined by its own parameters, specifically the degrees of freedom of the numerator and the denominator.
What is meant by 'critical value' in the context of the F distribution tables?
-The critical value, often denoted as F_sub_alpha, is the specific value of F from the table that corresponds to a given level of significance (alpha), indicating the threshold for rejecting the null hypothesis in a hypothesis test.
How is the level of significance (alpha) related to the confidence level in hypothesis testing?
-The level of significance (alpha) is the probability of rejecting the null hypothesis when it is true. It is the complement of the confidence level, so a 95% confidence level corresponds to a 0.05 level of significance.
What are the common values of alpha used in hypothesis testing?
-The common values of alpha used in hypothesis testing are 0.05, 0.01, and 0.10, which correspond to 95%, 99%, and 90% confidence levels, respectively.
What is the role of degrees of freedom in the F distribution?
-Degrees of freedom in the F distribution refer to the number of independent values in a data set that are free to vary. In the context of the F distribution, there are degrees of freedom for the numerator (df1) and the denominator (df2), which are typically the sample sizes minus one for each respective sample.
How do you determine the correct table to use for a given hypothesis testing problem?
-To determine the correct table, you must first identify the level of significance (alpha) for your problem, then locate the table that corresponds to that alpha level. Additionally, you must consider the degrees of freedom for both the numerator and the denominator to find the correct intersection in the table.
Can you explain the concept of the 'rejection region' in hypothesis testing using the F distribution?
-The rejection region is the area under the F distribution curve that leads to the rejection of the null hypothesis. It is defined by the critical value (F_sub_alpha) and represents the threshold that the test statistic must exceed for the null hypothesis to be rejected.
What is the significance of the test statistic in the context of the F distribution?
-The test statistic in the context of the F distribution is the ratio of the sample variances from two populations. It is used to determine whether there is a significant difference between the variances, which informs the decision to reject or fail to reject the null hypothesis.
How can you find the critical value of F for a hypothesis testing problem with a given alpha and sample sizes?
-To find the critical value of F, you first identify the correct table for the given alpha level. Then, calculate the degrees of freedom for both the numerator and the denominator based on the sample sizes (sample size minus one). Finally, locate the intersection of these degrees of freedom in the table to find the critical value of F.
Outlines
📚 Introduction to the F Distribution and Hypothesis Testing
This paragraph introduces the concept of the F distribution in the context of hypothesis testing in statistics. It explains that the F distribution is not a single table but a series of tables, which can be confusing at first. The speaker aims to clarify this by using a mental image of the F distribution as a skewed curve. The critical value, F sub alpha, is highlighted as a key concept, which represents a specific value from the F distribution table that corresponds to the area to the right under the curve, representing the level of significance (alpha). Common levels of significance, such as 90%, 95%, and 99% confidence levels, are mentioned, with their corresponding alpha values. The importance of understanding the degrees of freedom for both the numerator and the denominator in the context of sample variances is also discussed.
🔍 How to Use F Distribution Tables for Hypothesis Testing
The speaker provides a step-by-step guide on how to use the F distribution tables found in statistics textbooks. They explain that the tables are used to find the critical value (F sub alpha) for a given level of significance and degrees of freedom. The degrees of freedom are determined by the number of samples minus one for both the numerator and the denominator. The paragraph emphasizes the importance of selecting the correct table based on the level of significance and then finding the appropriate intersection of degrees of freedom to obtain the F value. It also points out that the tables are segmented for different sample sizes and that not all values are present due to space constraints, but there are formulas and computer programs available for more precise calculations.
📉 Understanding the F Distribution Table Structure and Examples
This paragraph delves deeper into the structure of the F distribution table and provides examples of how to read and interpret the values. It explains that the tables are organized by the level of significance (alpha) and the degrees of freedom for both the numerator and the denominator. The speaker uses specific examples to illustrate how to find the critical F value for different alpha levels, such as 0.01, 0.05, and 0.1, corresponding to 99%, 95%, and 90% confidence levels, respectively. The examples show how to locate the correct table, determine the appropriate degrees of freedom, and find the intersection point that yields the critical F value, which is essential for setting up the rejection region in hypothesis testing.
📝 Practical Application of F Distribution Tables in Hypothesis Testing
The final paragraph focuses on the practical application of the F distribution tables in solving hypothesis testing problems. It provides a hypothetical scenario involving sampling from two populations and demonstrates the process of finding the critical F value for given alpha levels and sample sizes. The speaker reiterates the importance of using the correct table for the specified level of significance and correctly calculating the degrees of freedom. The paragraph concludes with a preview of upcoming lessons that will involve working through complete hypothesis testing problems using the F distribution tables, emphasizing the importance of understanding this process for statistical analysis.
Mindmap
Keywords
💡F Distribution
💡Critical Value
💡Level of Significance (alpha)
💡Hypothesis Testing
💡Degrees of Freedom
💡Test Statistic
💡Rejection Region
💡Confidence Level
💡Sample Variance
💡Null Hypothesis
Highlights
Introduction to the F-distribution and its tables for statistical hypothesis testing.
The F-distribution consists of a series of tables, which can be confusing for beginners.
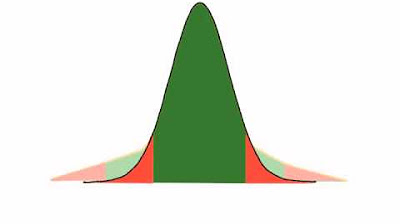
Mental image of the F-distribution is described as lopsided and skewed to the right.
Explanation of finding the critical value, F sub alpha, from the F-distribution table.
F sub alpha represents the special value of F with an area to the right corresponding to the level of significance, alpha.
Common values of alpha are 0.1, 0.05, and 0.01, corresponding to 90%, 95%, and 99% confidence levels.
The importance of understanding the concept of degrees of freedom in the context of the F-distribution.
Degrees of freedom are calculated as the number of samples minus one for both the numerator and the denominator.
How to use the F-distribution table to find the correct value of F given the degrees of freedom and the level of significance.
Different tables are used for different levels of significance, such as 0.01, 0.05, and 0.1.
The table's layout and how it is structured with degrees of freedom and alpha levels.
Limitations of the table, such as not having every possible value due to space constraints.
The necessity of using the correct table for the appropriate level of significance in hypothesis testing.
Quick exercises to practice reading values from the F-distribution table.
How to determine the critical value of F for a given alpha level and degrees of freedom.
The critical value F sub alpha defines the rejection region in hypothesis testing.
Upcoming lessons will involve applying the understanding of F-distribution tables to solve real statistical problems.
Transcripts
Browse More Related Video
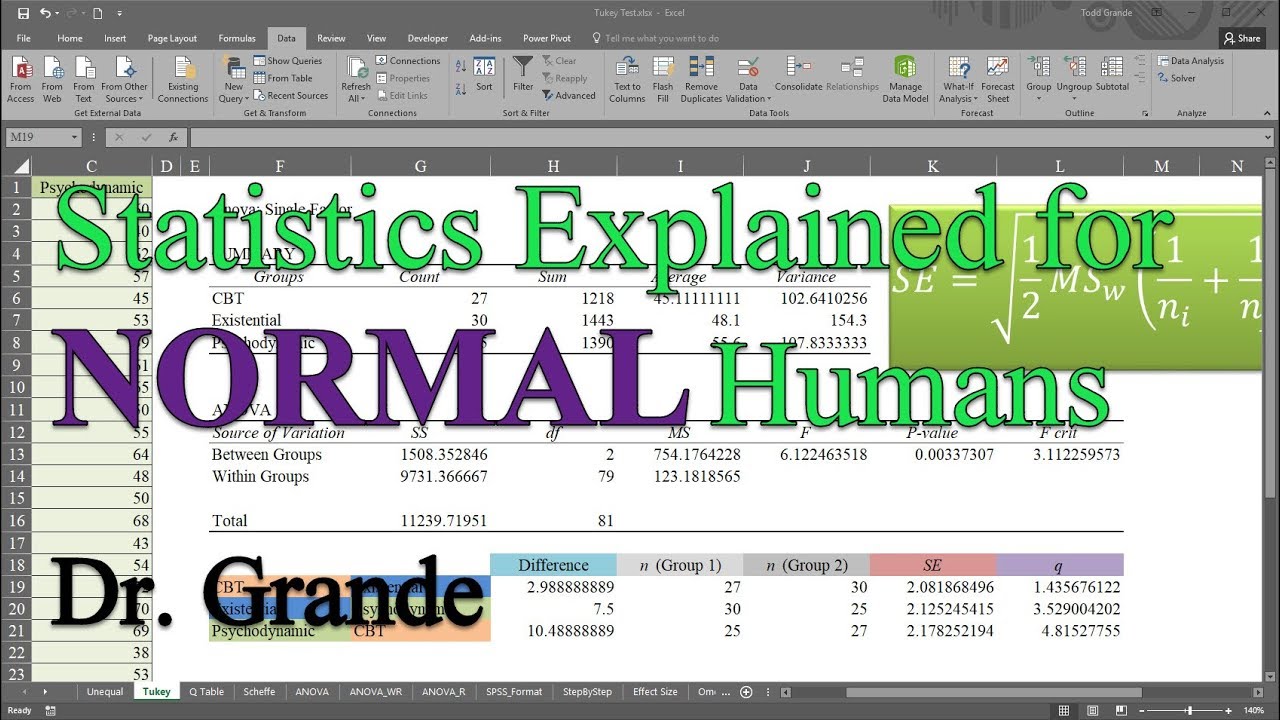
Tukey-Kramer Post Hoc Test after One-Way ANOVA in Excel
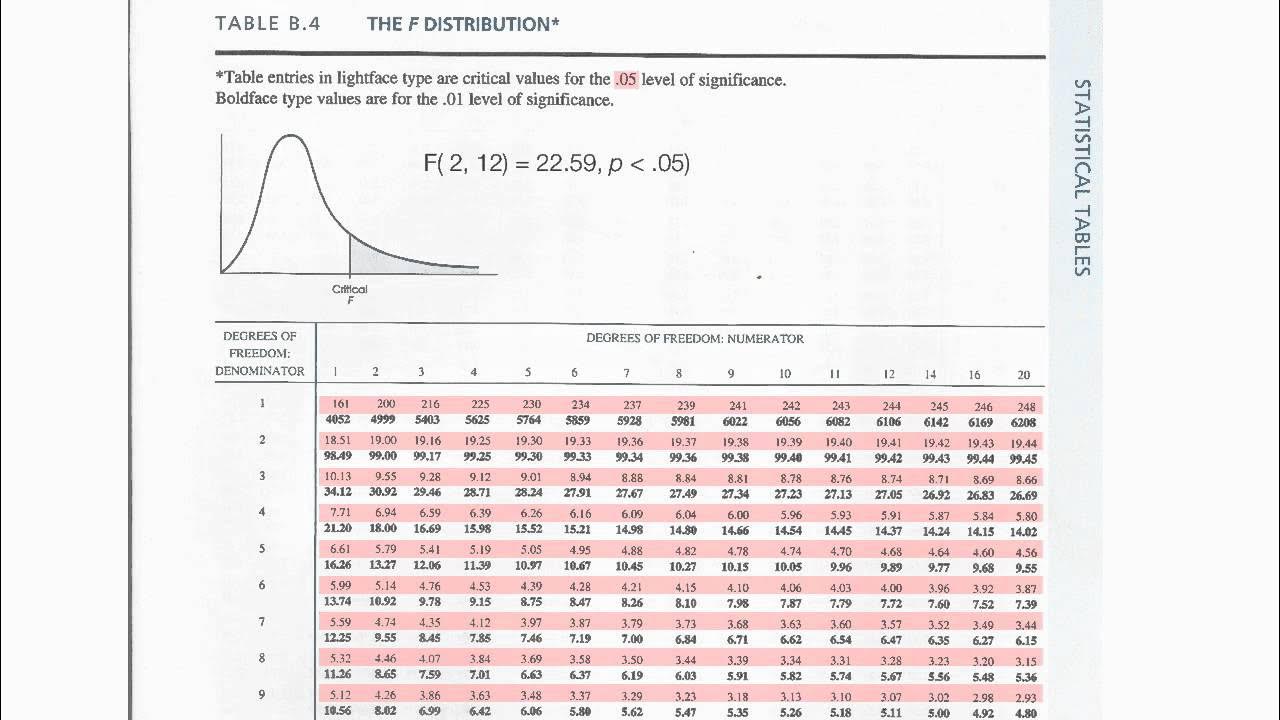
How to read F Distribution Table used in Analysis of Variance (ANOVA)
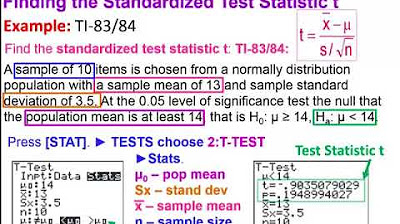
How to calculate t distributions
Elementary Statistics - Chapter 8 - Hypothesis Testing Part 3 Revised
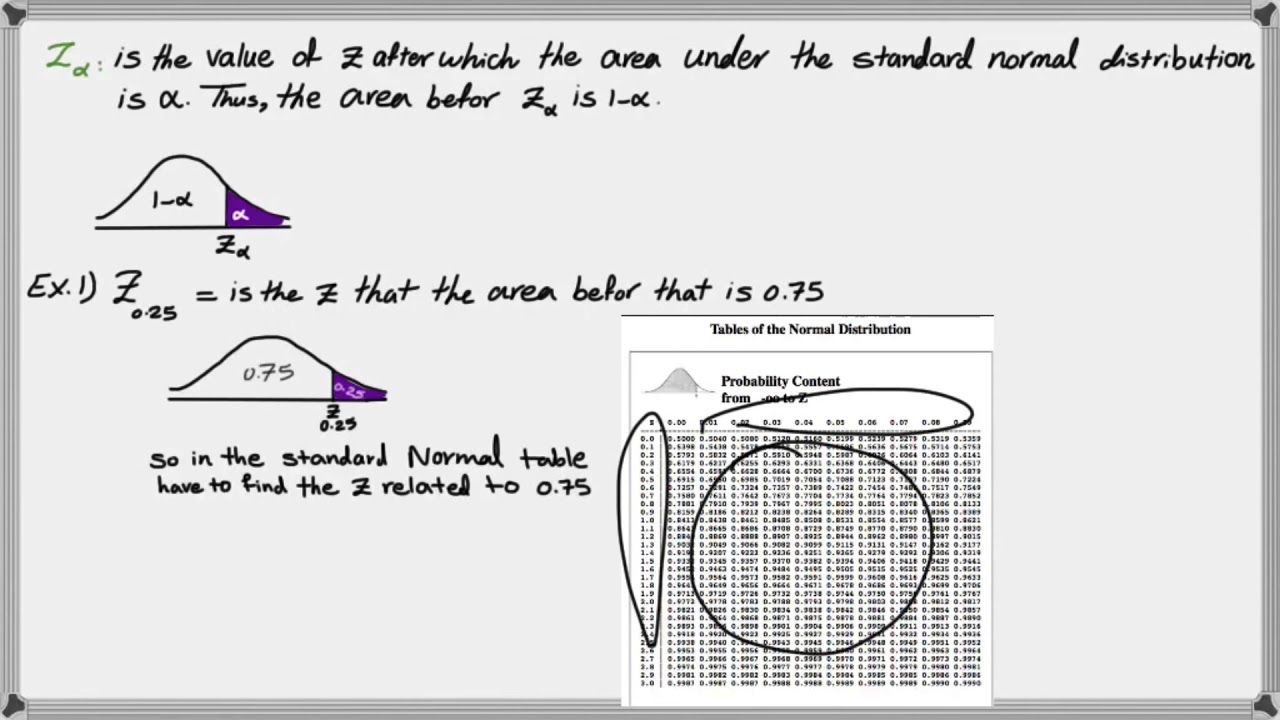
How to find critical Z value (Z alpha)
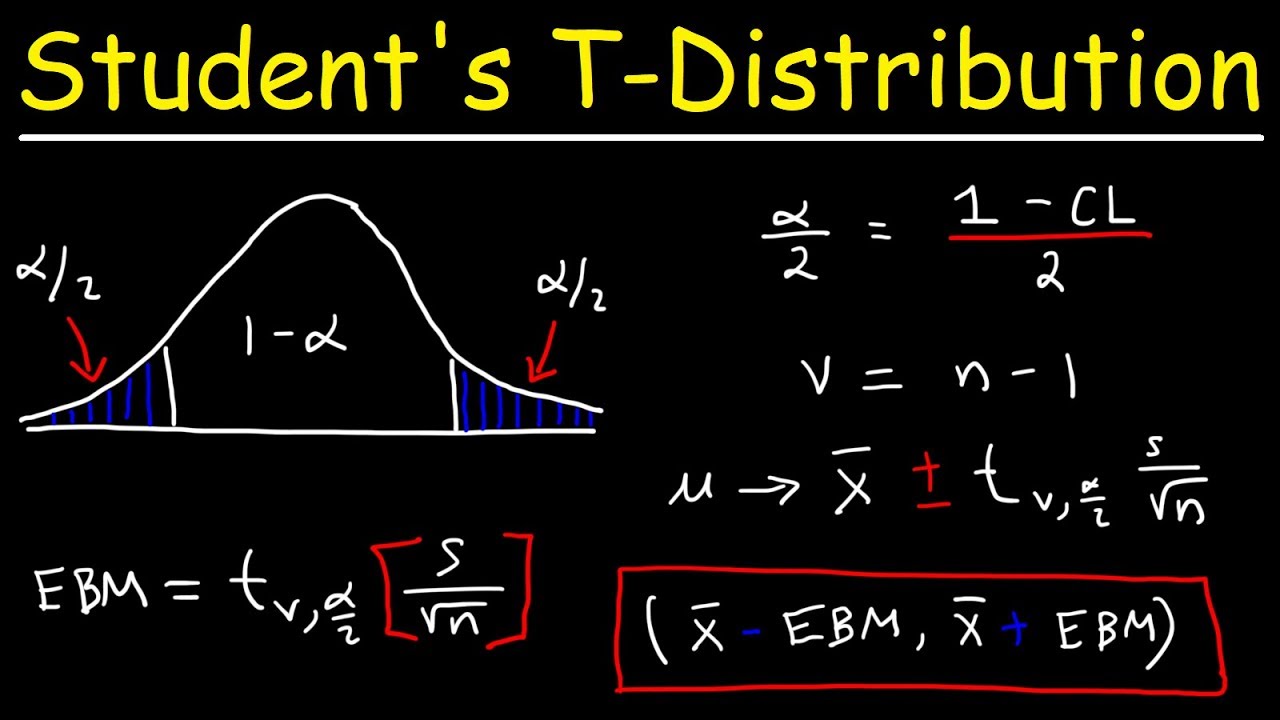
Student's T Distribution - Confidence Intervals & Margin of Error
5.0 / 5 (0 votes)
Thanks for rating: