Using TI-84 to calculate binomial probability distribution
TLDRThis video tutorial demonstrates how to calculate binomial probability distributions using a TI graphing calculator. It explains the process of translating word statements into inequality statements and applies this to a survey-based example involving Twitter awareness among adults. The video guides viewers through calculating the probability of exactly three, at least three, less than three, more than three, and at most three adults knowing about Twitter, utilizing both binompdf and binomcdf functions. The step-by-step instructions simplify the process, making it accessible for viewers to understand and apply these concepts in real-world scenarios.
Takeaways
- 📊 The video teaches how to calculate binomial probability distribution using a TI graphing calculator.
- 👩🏫 It covers how to translate word statements into inequality statements.
- 🔢 Example: There's a 0.85 probability that a randomly selected adult knows what Twitter is.
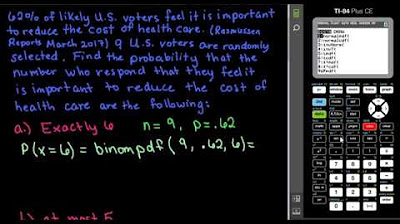
- 👥 Task: Find the probability that exactly 3 out of 5 randomly selected adults know what Twitter is.
- 📉 Use the 'binompdf' function in the TI calculator: enter number of trials (5), probability (0.85), and x value (3). Result: 0.138.
- ⬆️ Task: Find the probability that at least 3 out of 5 adults know what Twitter is (3, 4, or 5).
- 📈 Use the 'binomcdf' function: enter number of trials (5), probability (0.85), and x value (2). Subtract result from 1. Result: 0.973.
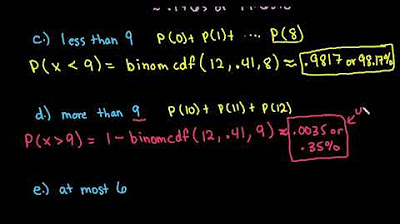
- ⬇️ Task: Find the probability that fewer than 3 out of 5 adults know what Twitter is (0, 1, or 2).
- 📉 Use 'binomcdf' with x value 2. Result: 0.0266.
- ⬆️ Task: Find the probability that more than 3 out of 5 adults know what Twitter is (4 or 5). Use complementary rule: 1 - binomcdf(5, 0.85, 3). Result: 0.835.
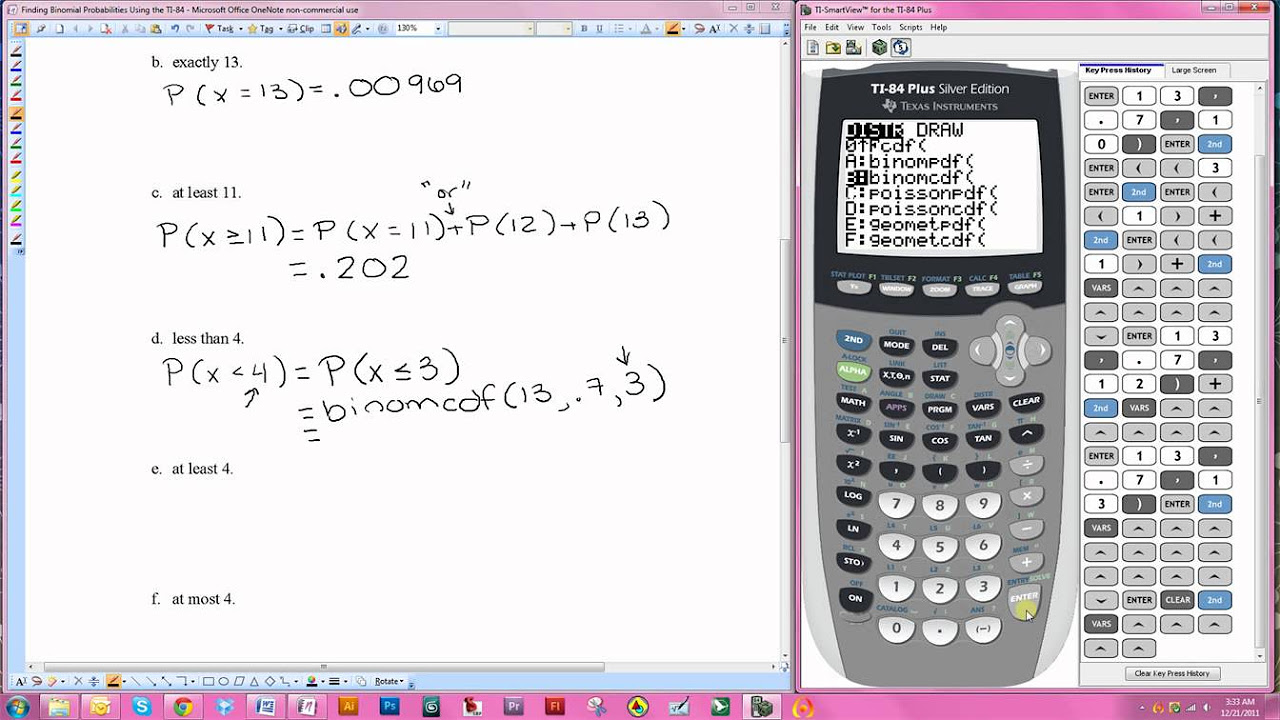
- ⬇️ Task: Find the probability that at most 3 out of 5 adults know what Twitter is (0, 1, 2, or 3). Use 'binomcdf' with x value 3. Result: 0.165.
Q & A
What is the probability that an adult knows what Twitter is, according to the Pew Research Center survey?
-The probability is 0.85.
How do you find the probability that exactly three out of five adults know what Twitter is using a TI graphing calculator?
-Use the 'binompdf' function with the parameters: number of trials (n) = 5, probability (p) = 0.85, and x value = 3. The result is approximately 0.138.
What function do you use to find the cumulative probability in a TI graphing calculator?
-Use the 'binomcdf' function to find cumulative probabilities.
How do you calculate the probability that at least three out of five adults know what Twitter is using a TI graphing calculator?
-Calculate 1 minus the cumulative probability for x = 2 using 'binomcdf' with parameters: number of trials (n) = 5, probability (p) = 0.85, and x value = 2. The result is approximately 0.973.
How do you find the probability that fewer than three out of five adults know what Twitter is?
-Use the 'binomcdf' function with parameters: number of trials (n) = 5, probability (p) = 0.85, and x value = 2. The result is approximately 0.0266.
How can you calculate the probability that more than three out of five adults know what Twitter is?
-Calculate 1 minus the cumulative probability for x = 3 using 'binomcdf' with parameters: number of trials (n) = 5, probability (p) = 0.85, and x value = 3. The result is approximately 0.835.
What does 'at most three' translate to in terms of probability for this scenario?
-'At most three' translates to finding the cumulative probability for x ≤ 3.
How do you find the probability that at most three out of five adults know what Twitter is using a TI graphing calculator?
-Use the 'binomcdf' function with parameters: number of trials (n) = 5, probability (p) = 0.85, and x value = 3. The result is approximately 0.165.
What does the 'binompdf' function calculate in a TI graphing calculator?
-The 'binompdf' function calculates the probability of getting exactly x successes in n trials for a binomial distribution.
Why do you need to use the complementary rule to find certain probabilities in this scenario?
-The complementary rule is used to simplify calculations when finding the probability of 'at least' or 'more than' scenarios by subtracting the cumulative probability of the complementary event from 1.
Outlines
📊 Understanding Binomial Probability Distribution with a TI Graphing Calculator
This section introduces the process of calculating the binomial probability distribution using a TI graphing calculator. It begins with an example where there's an 85% probability that a randomly selected adult knows what Twitter is. The task is to find the probability that exactly three out of five randomly selected adults know Twitter. It walks through the steps of entering data into the calculator, using the 'binompdf' function, and interpreting the result, which is approximately 0.138. Additionally, it covers how to find the probability that at least three of the five adults know Twitter using the 'binomcdf' function and the complementary rule, resulting in a probability of 0.973.
🔍 Calculating Probabilities for Different Scenarios
This section explores various probability scenarios involving the same group of five adults. It details how to find the probability that less than three of the five adults know Twitter using the 'binomcdf' function, resulting in a probability of 0.0266. It then explains how to find the probability that more than three adults know Twitter by using the complementary rule and the 'binomcdf' function to calculate the probability of x ≤ 3, and then subtracting from 1, resulting in 0.835. Lastly, it shows how to determine the probability that at most three adults know Twitter, which involves summing probabilities of x ≤ 3 using the 'binomcdf' function, giving a result of 0.165.
Mindmap
Keywords
💡Binomial Probability Distribution
💡TI Graphing Calculator
💡Binompdf
💡Binomcdf
💡Complementary Rule
💡Cumulative Distribution
💡n (Number of Trials)
💡p (Probability of Success)
💡x (Number of Successes)
💡Pew Research Center Survey
Highlights
The video demonstrates how to calculate the binomial probability distribution using a TI graphing calculator.
It explains the process of translating a word statement into an inequality statement for probability calculations.
An example is provided based on a Pew Research Center survey, where an adult has an 85% chance of knowing what Twitter is.
The sample size (n) is set to 5 adults for all parts of the demonstration.
The probability of exactly 3 out of 5 adults knowing about Twitter is calculated using the binompdf function on the calculator.
Instructions are given on how to input values into the TI-83 calculator for binomial probability distribution.
The result is rounded to three significant digits, showing 0.138 as the probability.
The video explains how to find the probability of 'at least 3' adults knowing about Twitter using the binomcdf function.
A faster method for calculating cumulative probabilities is introduced using the binomcdf function.
The complementary rule is applied to find the probability of 'at least 3' by subtracting from 1.
The final result for 'at least 3' adults knowing about Twitter is given as 0.973.
A shortcut method for using the binomcdf function is demonstrated to simplify calculations.
The probability of 'less than 3' adults knowing about Twitter is calculated using the binomcdf function with x value 2.
The result for 'less than 3' is 0.0266, indicating the probability of 0, 1, or 2 adults knowing about Twitter.
The video shows how to calculate the probability of 'more than 3' adults knowing about Twitter using the complementary rule.
The probability for 'more than 3' is found by subtracting the cumulative probability of 'less than or equal to 3' from 1.
The final result for 'at most 3' adults knowing about Twitter is calculated using the binomcdf function with x value 3.
The probability of 'at most 3' is given as 0.165, rounded to three significant digits.
The video concludes with a summary of the steps and methods used for calculating various binomial probabilities.
Transcripts
Browse More Related Video

5.0 / 5 (0 votes)
Thanks for rating: