Math 119 Chap 8 part 3
TLDRIn this educational video, the presenter concludes Chapter Eight by guiding viewers through a statistical hypothesis test on supermodel heights, using a sample of 10 to determine if their standard deviation significantly differs from the general population's 2.6 inches at a 0.01 significance level. The video demonstrates the process of formulating hypotheses, calculating the test statistic, and determining the p-value, which leads to the rejection of the null hypothesis. Additionally, the presenter discusses confidence intervals, contrasting their use with hypothesis tests, and applies this to leisure time data, concluding with the rejection of the claim that Americans spend an average of 18 hours a week on leisure activities.
Takeaways
- 📚 The script concludes Chapter 8 and introduces the start of Chapter 9, indicating a transition in the educational content.
- 🧐 A hypothesis test is conducted to evaluate if supermodel heights have a different standard deviation than the general population, using a 0.01 significance level.
- 📉 The normal distribution assumption is made for the heights of supermodels, which is crucial for the statistical test being performed.
- 📝 The null hypothesis (H0) states that the standard deviation of supermodel heights equals 2.6 inches, while the alternative hypothesis (H1) claims it is different.
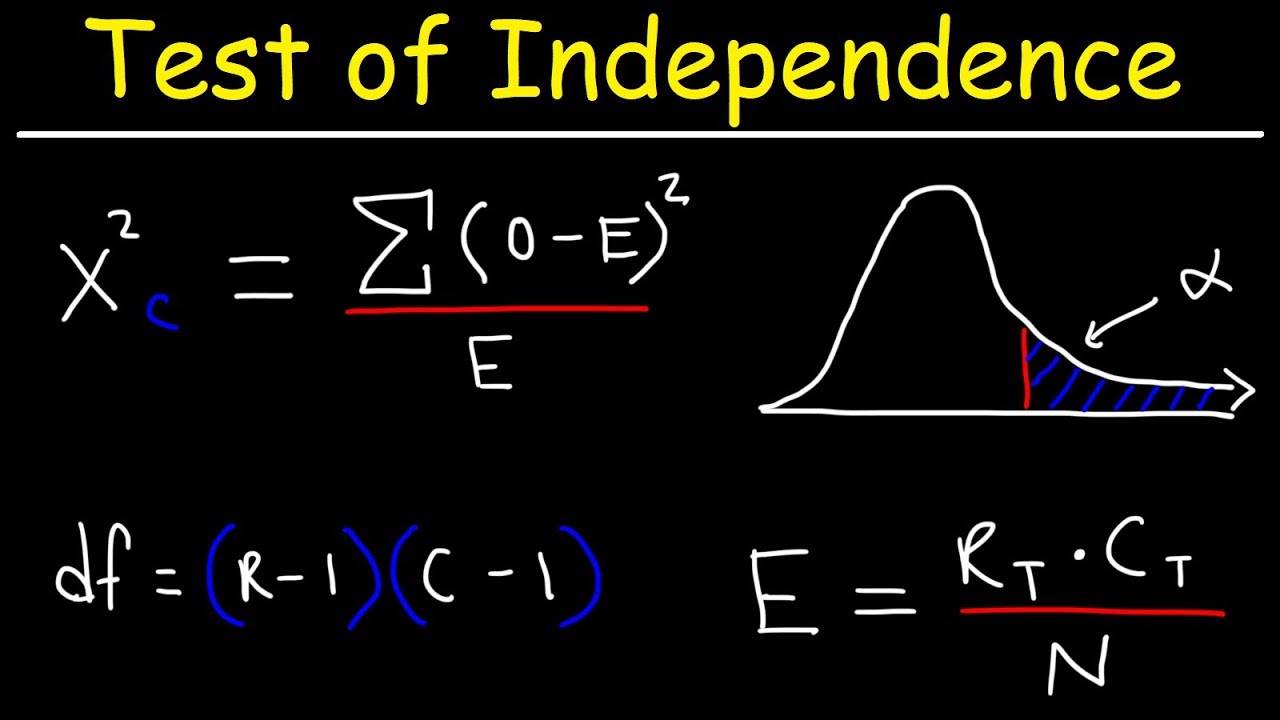
- 🔢 The test statistic is calculated using the formula chi-squared = (n-1) * (sample standard deviation)^2 / (population standard deviation)^2, where n is the sample size.
- 📊 The sample standard deviation is determined to be approximately 0.8, which is used to compute the chi-squared test statistic.
- 📈 The chi-squared distribution is used to find the p-value, which is compared against the alpha level to make a decision on the null hypothesis.
- 🤔 The p-value obtained (5.809 × 10^-4) is less than the alpha level, leading to the rejection of the null hypothesis in favor of the alternative.
- 📘 The conclusion drawn is that there is sufficient evidence to suggest that the standard deviation of supermodel heights is different from the general population.
- 📊 A confidence interval is constructed for the mean time spent on leisure activities by Americans, aiming to test a claim about the average time spent.
- 🤷♂️ The script notes that confidence intervals for proportions cannot be used in the same way as hypothesis tests to make decisions or draw conclusions about proportions.
- 🔑 The script emphasizes the importance of understanding the process of hypothesis testing and constructing confidence intervals, as well as interpreting the results in the context of the problem.
Q & A
What is the significance level used in the hypothesis test for supermodel heights?
-The significance level used in the hypothesis test for supermodel heights is 0.01.
What is the claim being tested in the supermodel height hypothesis test?
-The claim being tested is that the standard deviation of supermodel heights is different from the standard deviation of the general population's heights, which is 2.6 inches.
What is the sample size for the supermodel height hypothesis test?
-The sample size for the supermodel height hypothesis test is 10 supermodels.
What statistical test is used to calculate the test statistic for the supermodel height hypothesis test?
-The chi-squared test is used to calculate the test statistic for the supermodel height hypothesis test.
How is the test statistic calculated in the supermodel height hypothesis test?
-The test statistic is calculated as (n - 1) times the sample standard deviation squared, divided by the population standard deviation squared.
What is the sample standard deviation of the supermodel heights?
-The sample standard deviation of the supermodel heights is approximately 0.8 inches.
What is the result of the chi-squared test statistic calculation?
-The result of the chi-squared test statistic calculation is approximately 0.852.
How is the p-value determined in the hypothesis test?
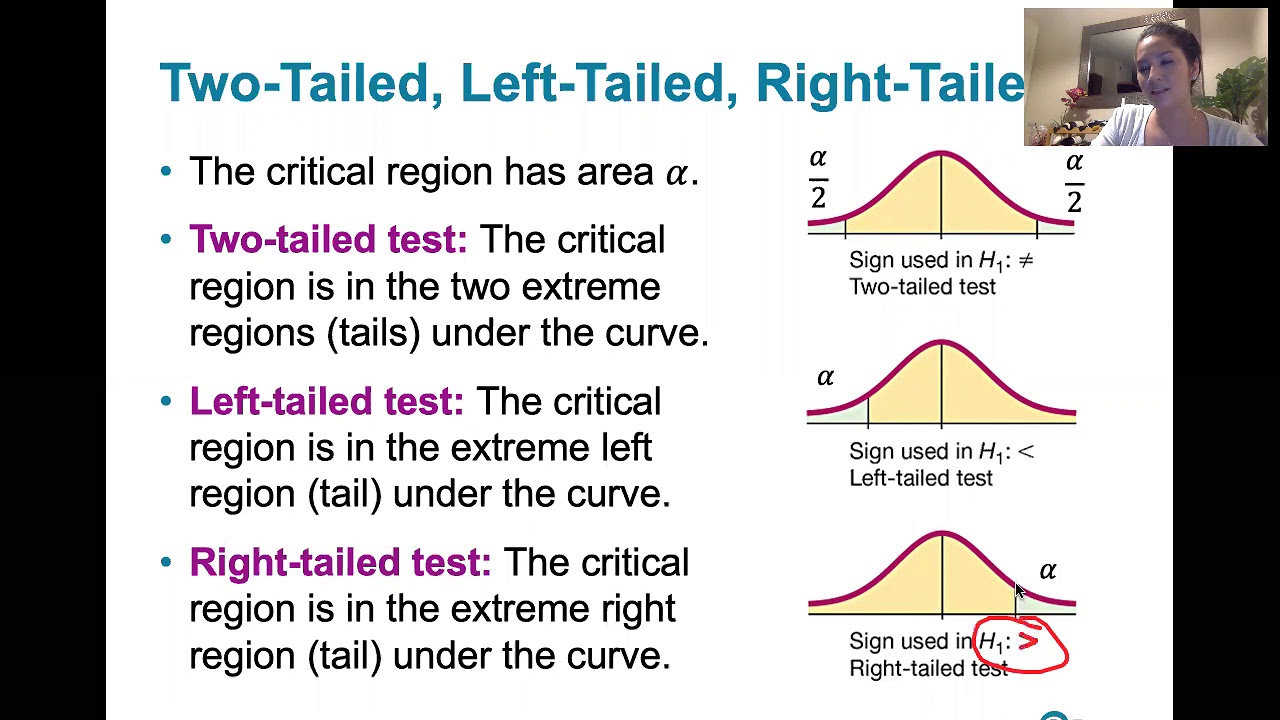
-The p-value is determined using the chi-squared distribution and the calculated test statistic, considering the degrees of freedom and the two-tailed nature of the test.
What is the p-value obtained from the hypothesis test?
-The p-value obtained from the hypothesis test is 5.809 times 10 to the negative 4.
What decision is made based on the p-value compared to the significance level?
-Since the p-value is less than the significance level of 0.01, the null hypothesis is rejected, and the alternate hypothesis is accepted, indicating that there is sufficient evidence to support that the standard deviation of supermodel heights is different from the general population.
How does the script differentiate between hypothesis testing and constructing a confidence interval?
-The script explains that while both hypothesis tests and confidence intervals can lead to similar conclusions, the process of constructing a confidence interval is different and is not used to make decisions or draw conclusions for hypothesis tests about proportions.
What is the purpose of constructing a confidence interval for the leisure time spent by adults?
-The purpose of constructing a confidence interval for the leisure time spent by adults is to test whether the amount of time spent on leisure activities is different from the claim that Americans spend an average of 18 hours a week on leisure activities.
How does the script suggest determining if the null hypothesis can be rejected based on the confidence interval?
-The script suggests that if the value stated in the null hypothesis (e.g., 18 hours) is not within the confidence interval, then the null hypothesis can be rejected.
What is the conclusion drawn from the confidence interval constructed for the leisure time spent by adults?
-The conclusion drawn is that there is 90% confidence that the true mean of leisure time is different than 18 hours, as 18 is not within the constructed confidence interval.
Outlines
📊 Hypothesis Testing for Supermodel Heights
The script discusses a hypothesis test on a sample of 10 supermodel heights to determine if their standard deviation significantly differs from the general population's standard deviation of 2.6 inches. Using a 0.01 significance level and assuming a normal distribution, the null hypothesis (H0: standard deviation equals 2.6) is tested against the alternative hypothesis (H1: standard deviation not equal to 2.6). The test statistic is calculated using the sample's standard deviation, and a chi-squared distribution is used to find the p-value. The result suggests rejecting the null hypothesis in favor of the alternative, indicating the supermodels' heights have a different standard deviation from the general population.
📈 Constructing a Confidence Interval for Leisure Time
This paragraph explains how to construct a confidence interval to test the claim that Americans spend an average of 18 hours per week on leisure activities. The researcher uses a sample of 10 adults to calculate the mean and standard deviation, then applies a t-interval calculation on a calculator to find the interval. The confidence level is set at 90%, resulting in an interval from 20.458 to 30.942 hours. The null hypothesis (H0: average leisure time equals 18 hours) is compared to this interval. Since 18 is not within the interval, the null hypothesis is rejected, suggesting that the true mean of leisure time is different from the claimed 18 hours.
🔍 Hypothesis Testing vs. Confidence Intervals
The script differentiates between hypothesis testing and confidence intervals, noting that while both can lead to similar conclusions, confidence intervals for proportions cannot be used for hypothesis testing. The example provided involves testing the claim of 18 hours of leisure time spent by Americans, using the same sample data. The paragraph emphasizes the importance of understanding whether the null hypothesis value falls within the confidence interval to make a decision about the hypothesis.
📚 Conclusion of Chapter Eight and Preview of Chapter Nine
The final paragraph wraps up the discussion on hypothesis testing and confidence intervals, indicating the end of chapter eight. It also provides a preview for the upcoming chapter nine, which will delve deeper into confidence interval information. The speaker intends to create another video to continue the educational content, ensuring that viewers have a clear understanding of the concepts covered.
Mindmap
Keywords
💡Random Sample
💡Significance Level
💡Standard Deviation
💡Normal Distribution
💡Null Hypothesis
💡Alternate Hypothesis
💡Chi-Squared Test
💡Test Statistic
💡P-Value
💡Confidence Interval
💡Hypothesis Test
Highlights
Introduction to the final section of Chapter Eight with a focus on testing the claim about supermodel heights using a 0.01 significance level.
Explanation of the hypothesis testing process for supermodel heights against the general population's standard deviation.
Assumption that supermodel heights follow a normal distribution for the hypothesis test.
Identification of the null hypothesis (standard deviation equals 2.6 inches) and the alternative hypothesis (standard deviation is not equal to 2.6 inches).
Calculation of the test statistic using the chi-squared formula for a two-tailed test with an alpha of 0.01.
Determination of the sample standard deviation and the calculation of the chi-squared value.
Use of a calculator to find the chi-squared value and the subsequent p-value for the test.
Interpretation of the p-value in the context of the hypothesis test, leading to the rejection of the null hypothesis.
Discussion on the difference between hypothesis testing and constructing a confidence interval for decision-making.
Construction of a confidence interval for the average leisure time of Americans based on a sample.
Use of a calculator to perform a t-interval calculation for the leisure time data.
Comparison of the null hypothesis value (18 hours) with the confidence interval to decide whether to reject the null hypothesis.
Conclusion that there is sufficient evidence to reject the claim that the average leisure time equals 18 hours.
Explanation of how the confidence interval can lead to a similar conclusion as the hypothesis test in this scenario.
Discussion on the potential outcomes if the null hypothesis were set at a different value within the confidence interval.
Announcement of the completion of Chapter Eight and the upcoming video for Chapter Nine focusing on more confidence interval information.
Transcripts
okay let's finish up chapter eight so this will be the last few pages from chapter eight um and
then I'll try to post another video for the start of chapter nine so we have this problem it says
consider a random sample of 10 supermodel heights listed below we wish to use a 0.01 significance
level um to test the claim that supermodel heights are different than standard deviation of heights
in general population which is 2.6 inches assume that heights of supermodels follows a normal
distribution so we got our normal distribution we have our sample size of n right 10 supermodels
um we have our alphas right here um and again I'm just kind of going through the motions here
clicking on every or checking everything that I do actually know for this particular problem
okay so um super model amount of different standard deviation and they say claim here's the claim that
the super model height or heights are different than the standard deviation of the heights of
the population which is 2.6 so that sentence right there gives us our claim and our alternate
hypothesis so we're going to start with that so our claim and our alternate or opposite claim
remember these are both claims and this is how we can write notation for this problem
so we have that the claim is that the standard deviation is different not equal to 2.6 which
is the general population and that the standard deviation is equal to 2.6 okay so
we're working with this let's see what we got so now we need our null
okay and we have our null to be standard deviation equals 2.6
and the alternate hypothesis is the standard deviation is not equal to 2.6 so once again
we know that this is a two-tail test and our alpha is worth .01
okay and again we've repeated this many times hopefully you guys are getting the hang of it
the alternate hypothesis tells us what type of tail test it's gonna be so we're going
to calculate our test statistic I'll do it right here chi squared is equal to n minus 1
times the standard deviation squared all over the standard deviation squared of the population
so what we need to do is we need to know that n minus 1 is 9 but we need to take our calculator
and plug the list of these values into our calculator so we can create our list so we're
going to create our list you guys are going to go and you know go to um stat edit list one and then
plug these values into list one and then you're gonna do stat and then single variable calculation
okay and you will get your standard deviation I'll write it up here or I'm sorry x bar is equal
to 69.825 and our s our standard deviation of the sample is worth
0.7997 so I'm going to say 0.78 or I'm sorry 0.800 or 0.8 okay so let's just clean this up oops
we're going to do the standard deviation of times 0.8 squared divided by um let's see here 2.6
squared I guess I don't need the parentheses
okay so then when I hit enter on my calculator I'm going to do 9 times 0.8 squared divided by
2.6 squared I get 0.852 um I guess .8521 if you want to round off to
four decimal places we could use three but it four should be fine
so I get .8521 okay well you know what let's round off to three because
normally they don't go much more than three on chi squared suppose so let's just go 0.852
um now we need to calculate our p value okay so once again we can do that with our calculator
so we're going to draw our chi-squared cdf uh distribution our chi squared distribution i'm
sorry and we know that 0.852 is somewhere right there and it's a two-tailed test so I
have this area and then I know somewhere over here there's a matching amount of area now it'll have a
different shape but it'll be the same amount of green if you if you had the same amount of area
um this one will on the right hand side it'll be thinner the one on the left hand side will
be a bigger slice but they both will be the same amount of area okay so we don't know this number
but we don't need to know because what we're looking for is the p-value and the p-value equals
and we're going to go into second vars on my calculator it's number eight i'm going to go into
chi-squared cdf and let's see what they ask for they want to know the lower bound so we can say
zero because we know that standard deviation starts at zero right this is a zero right here
and then we can go to our upper bound of 0.852 and degrees of freedom of nine so we're gonna go zero
.852 comma nine degrees of freedom and let's see what we get for our p value
I get 2.904 times 10 to the negative 4
but that's actually just the p value for that isn't there also the matching p value oh I'm sorry
that's the p value for way over here on the other side but we also have
this matching p value right there so we have to double this number so we double
to get our p value so this is actually
times two so I get 5.808 and I guess 09 times 10 to the negative 4
so this is my true p value the other one this number here is just the left-hand
side of my p-value but I need the whole p-value because this is a two-tailed test
so it's 5.809 times 10 to the negative 4 but it's still going to be the same
result because they're both very small numbers so we say since our p-value
5.809 times 10 to the negative 4 is less than
our
alpha equals 0.01 we reject the null and accept the alternate hypothesis okay and then you guys
I think you're getting used to doing interpret your decision in the context of the problem
we say there is sufficient evidence to support explain that the standard deviation of supermodel
supermodel
heights is different
from the general population of 2.6 okay that's what our decision was okay
so now we're also going to use a
a confidence interval and a hypothesis s um kind of in the same section so decision made
on a conclusion drawn from hypothesis tests about the mean and the standard deviation
can be made from constructing an appropriate confidence interval
the same cannot be said about confidence intervals for proportions being used to make decisions and
draw conclusions for hypothesis tests for the proportions okay so let's take a look at this
so it says a past study claims that adults americans spend too much time
on average of 18 or americans spend an average of 18 hours a week on leisure
activities a researcher wanted a researcher wanted to test this claim she took a random
sample of 10 adults and asked them about the time they spend per week on leisure activities
their responses and hours as follows so we've already done this problem okay
but now we're going to assume that now we're going to see let me see this one assume the time spent
on leisure activities by all students are normally just reuse the sample of information to construct
a confidence interval the confidence interval is different than a hypothesis test but oftentimes
they will lead to similar conclusions the hypothesis test had an alpha of 0.10
to test whether the amount of time spent on leisure is different than what has been claimed
so here's here's kind of the thing we're going to deal with here so
assume time spent on leisure activities by adults is normally distributed use the sample
information to construct a confidence interval so we're going to construct a
confidence interval for this problem so you guys remember how to do a confidence interval okay
confidence interval okay for t was we could use oh well we could use our calculator we
could use t interval that was the easier way that I showed you guys
so we could do a t interval and then let's build our confidence interval
so we're going to have to plug this into our calculator so let's go into stat
and edit and let's plug this in 14 25 22 38 16 26 19 23 41 33
so we have one two three four five six seven eight nine ten so I think we're good
so now I'm gonna go into stat test and then we're gonna do t interval
on my calculator it's number eight and this time we're going to use data because we
just plugged it in and our confidence level is what um it was 10 percent so we're going to say 90 percent 0.9
okay so I get oops um let's go into my interval would be
20 point I guess 458 and 30.942 okay so now it says assume
that the time spent on leisure activities and by all adults are normally distributed
so we got this we're doing good use the sample information to construct a confidence interval
okay to test whether the amount of time spent on leisure is different than what has been claimed
okay so the claim was what the null was that mu was equal to 18 and the alternate was that
mu is not equal to 18. okay so here's the thing we're trying to see if 18 is in there or not okay
so if 18 is in there then we cannot reject the null okay but if 18 is outside of this interval
then we can reject the null okay so let's see here if we had a number line right and we had 20.458
and then over here is 30.942 so we know that somewhere in here is the true mean we're not
exactly sure what it is but the true mean is somewhere in between 20 and 30 about 31. the
null is about 18 or the null is 18. well that's over here somewhere so here's 18.
okay it is not in this region right here it's not inside the interval so that means
that we can reject the null 18 is outside so we reject the null so since
18 is not in our interval
we reject
the claim that
or where we could say you know what let's say it this way this might be a little bit better
we reject the leisure time
equaling 18.
um so we are so we could say we are 90 percent confident that the true mean of leisure time
oops
is different than
18. but I want you guys to understand what we kind of did is didn't we reject the null and accept the
alternate hypothesis so it's another way to think about it right so because the null hypothesis
was not inside the confidence interval it's a way of being in outside of our
um it's not inside of what we would accept so this is a rejectable null okay now what if 18 was
so instead of saying that null was 18 what if they had said the null was like 23 well you
don't know for sure but is it possible that 23 is true that it could be the true mean time yes it
is possible so then we would not be able to reject the null we would have to fail to reject the null
okay so let's look at this other problem let's see how much more we've got left okay
okay so um this one I don't think I think we already did something very similar to this
so um I think I'm gonna have to write this one up differently because I think there's
an error in it I'm gonna have to double check it for you guys um so I'm gonna go ahead and
write this one up separately on a different um problem I don't believe we did this one already
so I'd like you guys to go over these two okay and this should be the end of chapter eight
okay um and then I will have another video on chapter nine and we're going to go over
more confidence interval information okay that'll do it for this quick video
Browse More Related Video
Test of Independence Using Chi-Square Distribution

p-value - easily explained with an example
Using StatCrunch to perform hypothesis testing on two matched pair means of acting award ages

P-values and significance tests | AP Statistics | Khan Academy
8.1.4 Basics of Hypothesis Testing - The Critical Value Method for a Population Proportion
Calculating Power and the Probability of a Type II Error (A One-Tailed Example)
5.0 / 5 (0 votes)
Thanks for rating: