7.1.2 Estimating a Population Proportion - Why We Need Confidence Intervals, How to Interpret Them
TLDRThis video script delves into the concept of confidence intervals as a more nuanced approach to estimating population proportions than point estimates. It explains the importance of using intervals to capture the uncertainty inherent in sampling and introduces the concept of confidence levels, which represent the probability that a confidence interval contains the true population parameter. The script clarifies common misconceptions about interpreting confidence intervals and emphasizes the success rate of the estimation process, rather than the probability of a single interval containing the parameter. It sets the stage for further discussion on critical values in subsequent lessons.
Takeaways
- 🔍 Confidence intervals provide a better estimate for population parameters by using a range of values instead of a single point estimate.
- 📊 A point estimate is a single number representing the best estimate of a population parameter, but it doesn't indicate how good the estimate is.
- 📈 Confidence intervals help to understand the reliability of a point estimate by providing an interval of values.
- 🔢 A confidence interval is centered at the point estimate and includes a margin of error around it.
- 📉 Confidence levels, denoted as 1 minus alpha, represent the probability that the confidence interval contains the true population parameter.
- 🔄 Confidence levels are often expressed as percentages, such as 95% or 99%, indicating the success rate of the process of creating confidence intervals.
- 🔬 The process involves repeatedly sampling and creating confidence intervals, with the confidence level indicating the proportion of intervals that contain the true population parameter.
- 🔁 A 95% confidence level means that if the process is repeated 100 times, 95 of those intervals will contain the true population parameter.
- 🚫 Common incorrect interpretations include thinking there's a 95% chance that a specific interval contains the true parameter, or that 95% of sample proportions fall within the interval.
- 🔍 Common confidence levels and their corresponding alpha values include 90% (alpha = 0.10), 95% (alpha = 0.05), and 99% (alpha = 0.01).
Q & A
What is the main purpose of using confidence intervals instead of point estimates?
-The main purpose of using confidence intervals is to provide a range of values that better estimate the true population parameter, acknowledging that there is always some error when using sample data to estimate the population due to chance and sampling variability.
What is the definition of a confidence interval?
-A confidence interval is a range or interval of values used to estimate the true value of a population parameter, centered around a point estimate with a margin of error included.
What does the abbreviation 'CI' stand for in the context of this script?
-In the context of this script, 'CI' stands for 'confidence interval'.
How is the confidence level related to the confidence interval?
-The confidence level is a probability, often represented as a percentage, that the computed confidence interval actually contains the population parameter, assuming the estimation process is repeated a large number of times.
What is the correct interpretation of a 95% confidence level?
-A 95% confidence level means that if the process of creating confidence intervals is repeated many times, 95 out of 100 times the interval will contain the true population parameter.
What is the common misinterpretation of a confidence interval?
-A common misinterpretation is thinking that there is a 95% chance that the true value of the population parameter lies within the interval, which is incorrect. The correct interpretation is that 95% of the intervals created in the process would contain the true parameter.
What is the relationship between confidence level and alpha?
-The confidence level is given by one minus alpha (1 - α). Alpha is the complement of the confidence level and represents the probability of the confidence interval not containing the true population parameter.
How does the success rate of the confidence interval process relate to the confidence level?
-The success rate of the process is directly related to the confidence level. For example, a 95% confidence level indicates that the process should result in a confidence interval containing the true population parameter 95% of the time.
Why is it incorrect to say that 95 percent of sample proportions fall between the confidence interval values?
-It is incorrect because the confidence interval is calculated based on a specific sample and does not provide information about the distribution of other sample proportions. It is about the success rate of the process of creating intervals, not the distribution of sample proportions.
What are some common confidence levels and their corresponding alpha values?
-Common confidence levels include 90% (α = 0.10), 95% (α = 0.05), and 99% (α = 0.01). These levels are typically given as percentages, but alpha values are given as decimal representations of the complement of the confidence level.
Outlines
📊 Understanding Confidence Intervals and Levels
This paragraph introduces the concept of confidence intervals as a method for estimating population proportions, explaining why they are superior to point estimates due to their ability to convey the uncertainty inherent in sampling. It defines a confidence interval as a range of values centered around a point estimate with a margin of error, and distinguishes it with the abbreviation 'CI'. The paragraph also introduces the concept of confidence level as the probability that the computed confidence interval contains the true population parameter, usually represented as a percentage like 95% or as a decimal (0.95). The explanation emphasizes the importance of correctly interpreting what a confidence interval signifies and what it does not, setting the stage for further discussion on the prerequisites for calculating confidence intervals.
🔢 The Significance of Confidence Levels in Estimation
This paragraph delves deeper into the interpretation of confidence levels, clarifying that they represent the success rate of the process used to create confidence intervals. It uses the example of a 95% confidence level to illustrate that if the process of creating confidence intervals is repeated numerous times, the true population proportion would be expected to fall within the interval 95% of the time. The paragraph dispels common misconceptions about confidence intervals, such as the incorrect belief that there is a 95% chance the true population parameter is within a specific interval or that 95% of sample proportions fall between the interval's bounds. It emphasizes the correct interpretation: with a 95% confidence level, if we were to create confidence intervals 100 times, 95 of those intervals would be expected to contain the true population proportion.
🚫 Common Misinterpretations of Confidence Intervals
The final paragraph addresses and corrects common misinterpretations regarding confidence intervals. It refutes the incorrect notion that there is a 95% chance the true population parameter lies within a specific interval, clarifying that the confidence level refers to the proportion of intervals that would contain the parameter if the process were repeated many times. The paragraph also dismisses the idea that 95% of sample proportions fall within the interval bounds, which is not what the confidence interval indicates. It concludes by outlining common confidence levels and their corresponding alpha values, such as 95% (α=0.05), 99% (α=0.01), and explains that these levels are used to determine the width of the confidence interval. The paragraph sets up the next topic to be discussed in the series: critical values in the computation of confidence intervals.
Mindmap
Keywords
💡Confidence Interval
💡Point Estimate
💡Confidence Level
💡Margin of Error
💡Population Parameter
💡Sample Proportion (p-hat)
💡Estimation Process
💡Alpha (α)
💡Interpretation
💡Critical Values
Highlights
The video discusses the use of confidence intervals as estimates for population proportions, emphasizing their importance over point estimates.
Point estimates are single numbers representing the best estimate of a population parameter, but they have inherent error due to sampling.
Confidence intervals provide a range of values that better estimate the population parameter, accounting for sampling error.
A confidence interval is centered at a point estimate with a margin of error, often abbreviated as CI.
Confidence level is defined as the probability that the computed confidence interval contains the true population parameter.
The confidence level is represented as a percentage, such as 95% or 99%, and is calculated as 1 minus alpha.
The success rate of the estimation process is indicated by the confidence level, which assumes repeated sampling and interval computation.
A 95% confidence level means that in 95 out of 100 times, the confidence interval should contain the true population parameter.
The video uses a graphic to illustrate that 95% is equivalent to 19 out of 20, helping to conceptualize the confidence level.
The video emphasizes the correct interpretation of confidence intervals and levels, correcting common misconceptions.
It clarifies that a confidence interval does not imply that the population proportion is equal to the sample proportion.
The video explains that the confidence level is about the success rate of creating intervals, not the likelihood of a specific interval containing the parameter.
Common confidence levels and their corresponding alpha values are discussed, such as 95% (alpha = 0.05) and 99% (alpha = 0.01).
The video will cover critical values in the next part, which are essential for computing confidence intervals.
The transcript provides a comprehensive understanding of confidence intervals, their calculation, and correct interpretation in statistical analysis.
The importance of understanding confidence intervals is highlighted for making informed decisions based on sample data.
The video concludes by reinforcing the practical applications of confidence intervals in estimating population parameters accurately.
Transcripts
Browse More Related Video

Confidence Intervals: Crash Course Statistics #20

Confidence Interval for a population proportion | Solved Problems

Math 119 Chap 7 part 1

What is a Confidence Interval? | Puppet Master of Statistics
Confidence Interval [Simply explained]
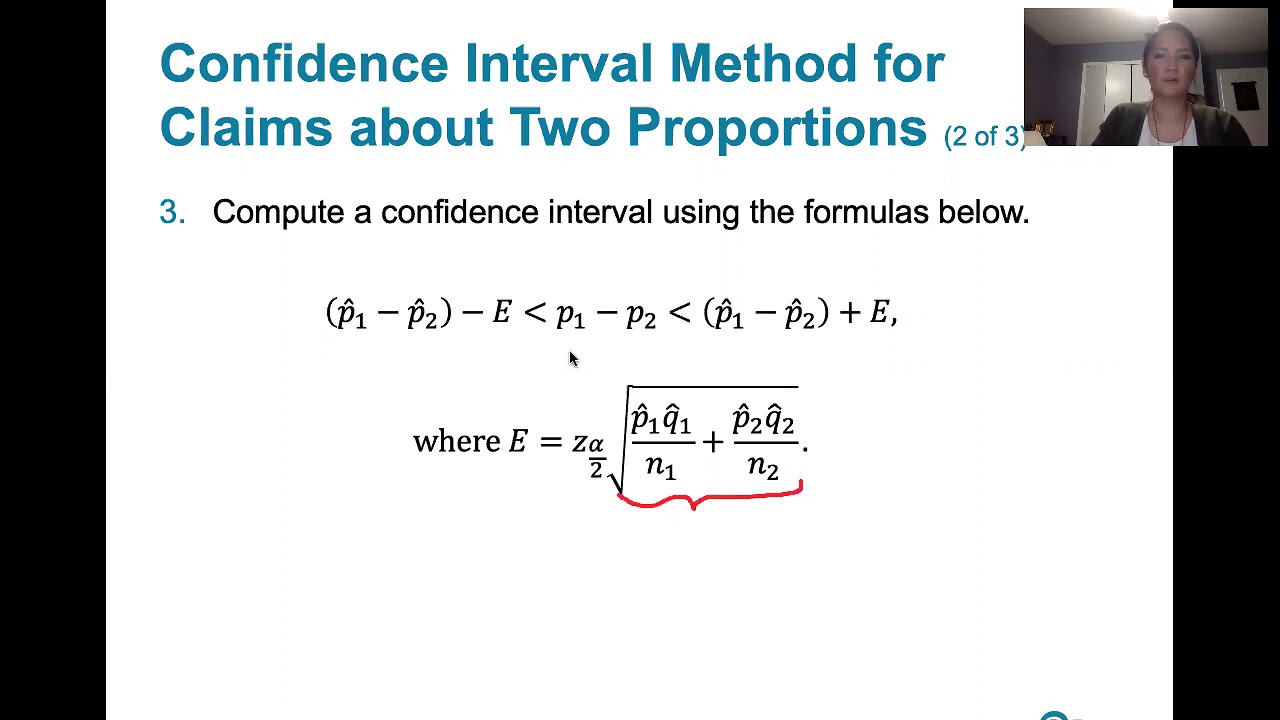
9.1.4 Two Proportions - Confidence Intervals for the Difference Between Two Proportions
5.0 / 5 (0 votes)
Thanks for rating: