6.2.0 Nonstandard Normal Distributions - Lesson Overview, Learning Outcomes, Key Concepts
TLDRThis video script offers an overview of Lesson 6.2, focusing on real-world applications of normal distributions. It's part of a four-section series from 'Essentials of Statistics' by Mario Triola, specifically the sixth edition. The lesson delves into non-standard normal distributions, explaining how they differ from the standard normal distribution with a mean of zero and a standard deviation of one. The script outlines learning outcomes, including understanding the relationship between areas and scores in normal distributions, converting x values to z scores, and vice versa. It also covers finding areas corresponding to x value ranges and determining x values from known areas or probabilities, using formulas to relate standard and non-standard normal distributions.
Takeaways
- 📚 The lesson is an overview of Lesson 6.2, focusing on real-world applications of normal distributions.
- 📈 The material is based on Pearson slides modified for the specific course, covering chapter six of 'Essentials of Statistics' by Mario Triola.
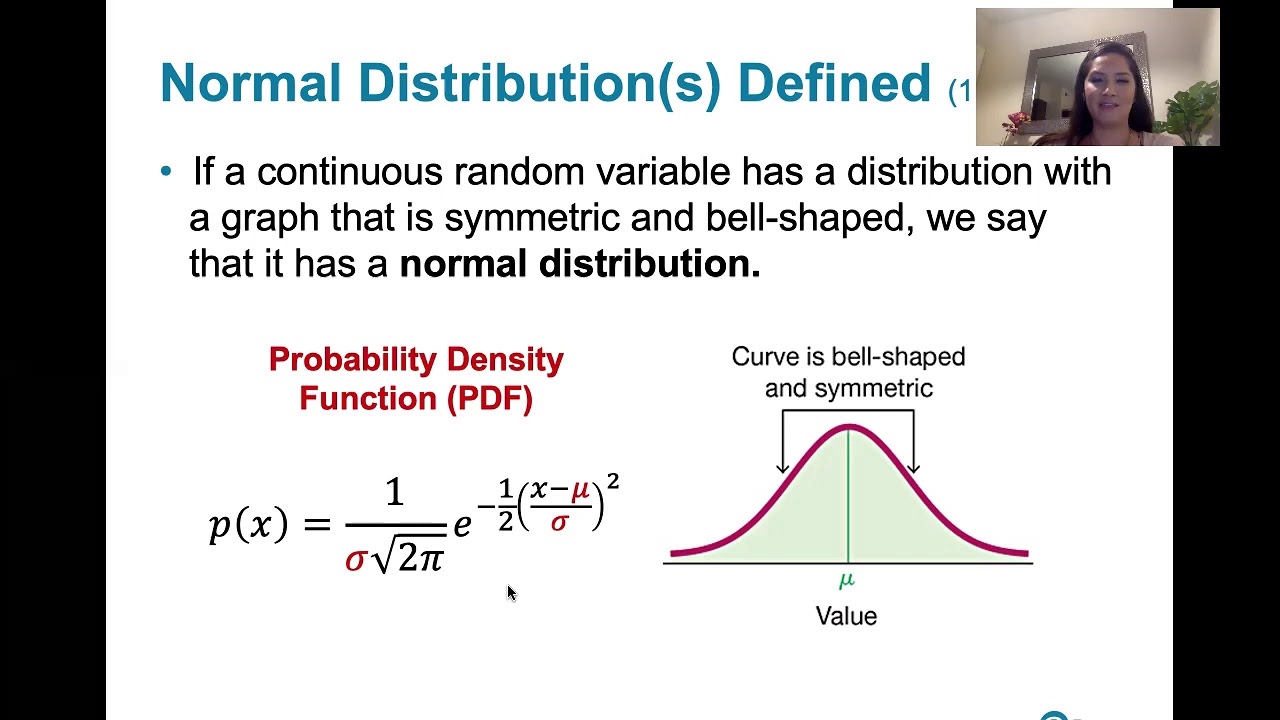
- 🔄 The lesson revisits continuous probability distributions and delves into non-standard normal distributions, which differ from the standard normal distribution in mean and standard deviation.
- 📉 Learning outcomes include understanding the relationship between areas and scores in both standard and non-standard normal distributions.
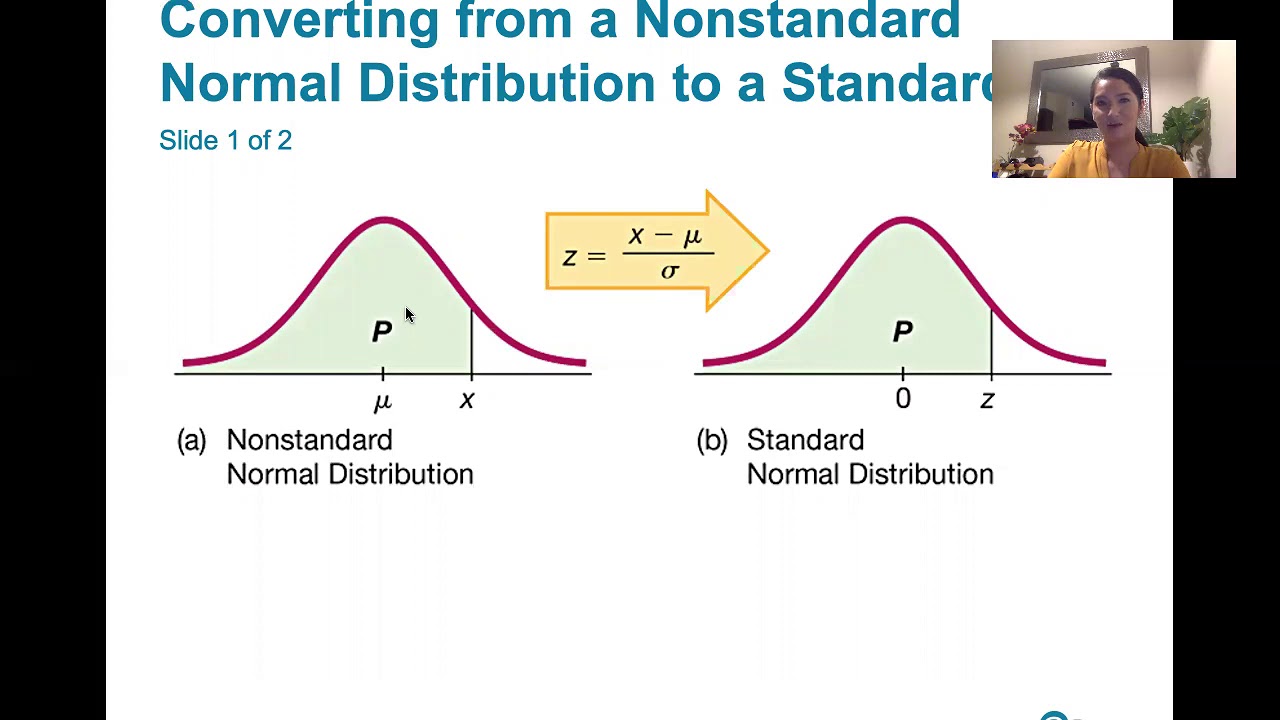
- 🔢 Review of formulas for converting x values to z scores and vice versa, previously introduced in chapter three.
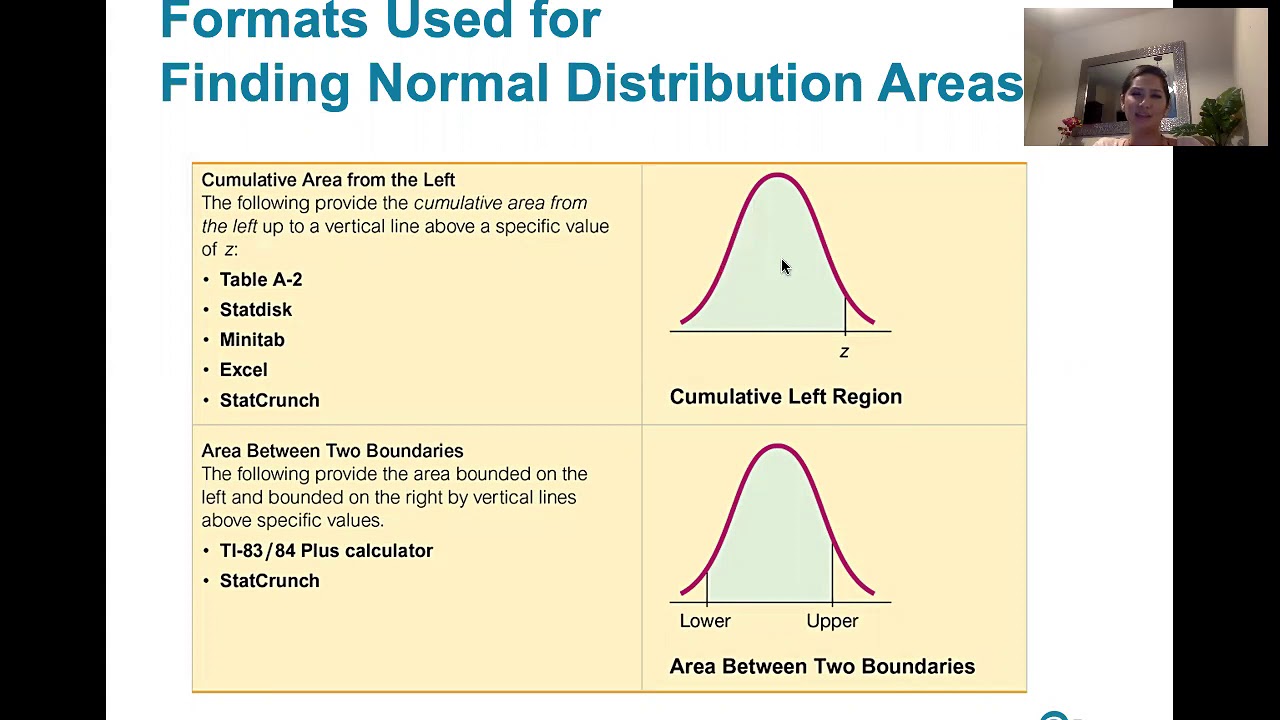
- 📊 The course will teach how to find areas or probabilities corresponding to a range of x values in a normal distribution.
- 🔍 Conversely, the course will also cover finding x values or ranges associated with known probabilities, a method for reverse lookup in normal distributions.
- 🌐 The material builds upon previous discussions about standard normal distributions, which have a mean of zero and a standard deviation of one.
- 📐 Non-standard normal distributions are related to standard normal distributions through simple conversion formulas, allowing for the calculation of areas and probabilities.
- 🔑 Key concepts include the understanding that non-standard normal distributions have different means and/or standard deviations from zero and one.
- 🎥 The instructor plans to cover the first learning outcome in the next video, continuing the exploration of normal distribution applications.
Q & A
What is the main topic of Lesson 6.2 in the provided video script?
-The main topic of Lesson 6.2 is the real applications of normal distributions, focusing on non-standard normal distributions and their relationship with standard normal distributions.
What are the key learning outcomes for this section of the course?
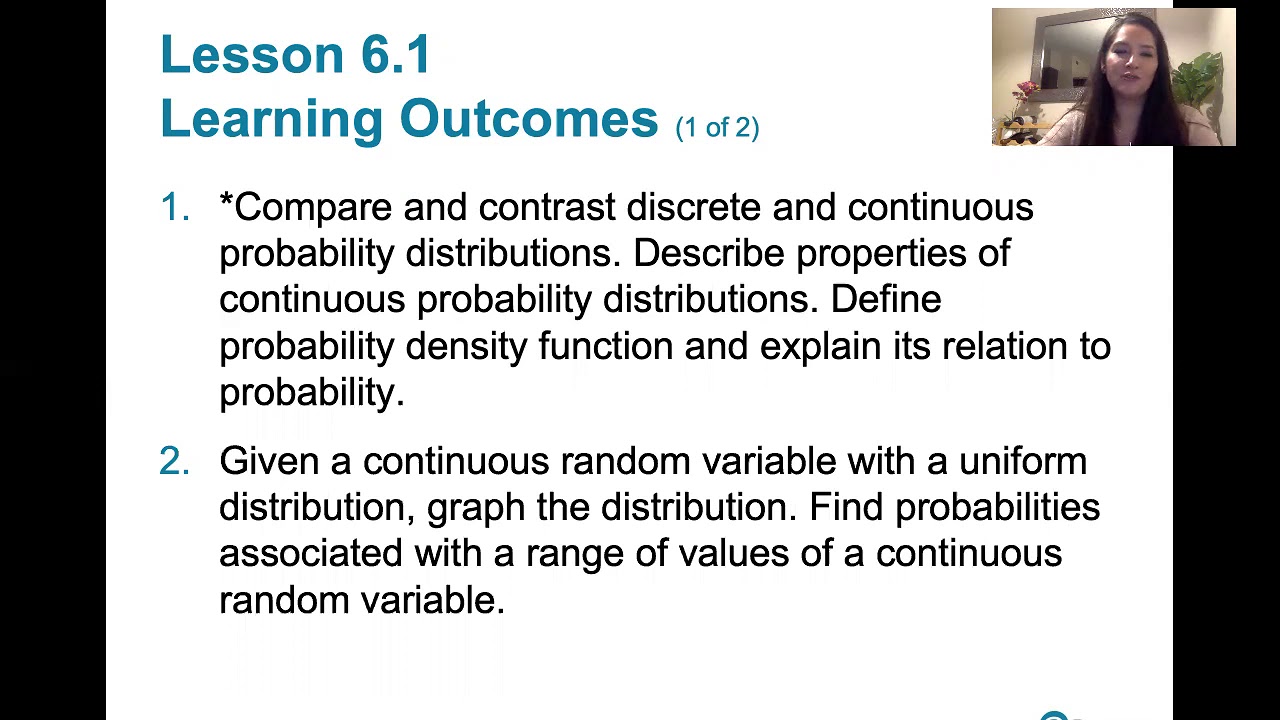
-The key learning outcomes include discussing the correspondence between areas and scores for standard and non-standard normal distributions, reviewing the formulas for converting from an x value to a z score and vice versa, finding areas corresponding to a given range of x values, and finding x values associated with known areas or probabilities.
What is the difference between a standard normal distribution and a non-standard normal distribution?
-A standard normal distribution has a mean of zero and a standard deviation of one. A non-standard normal distribution does not have these specific values for mean and standard deviation; it can have any mean and standard deviation other than zero and one, respectively.
Why is it important to understand the conversion between x values and z scores?
-Understanding the conversion between x values and z scores allows students to work with both standard and non-standard normal distributions, enabling them to find areas and probabilities for any normally distributed continuous random variable.
What is the significance of the formulas mentioned in the script for converting from an x value to a z score and vice versa?
-These formulas are crucial as they allow for the translation between the original scale of the data (x values) and the standardized scale (z scores), which simplifies the process of finding probabilities and areas under the normal distribution curve.
What does the script imply about the relationship between normal and standard normal distributions?
-The script implies that normal and standard normal distributions are closely related, with the ability to convert between them using simple formulas, allowing for the application of standard normal distribution properties to any normal distribution.
How does the script suggest that we find areas or probabilities given a range of x values in a normal distribution?
-The script suggests that by using the correspondence between standard and non-standard normal distributions, one can find areas or probabilities for a given range of x values in a normal distribution.
What is the purpose of revisiting the formulas for measures of relative standing discussed in Chapter 3?
-Revisiting these formulas in the context of normal distributions helps to reinforce the concepts and show their application in converting x values to z scores and interpreting areas under the normal distribution curve.
How does the script relate the concepts discussed in Lesson 6.2 to previous material covered in the course?
-The script relates Lesson 6.2 to previous material by connecting the concepts of z scores and probabilities discussed in the context of standard normal distributions to the broader application in non-standard normal distributions.
What is the script's approach to teaching the application of normal distributions in real-world scenarios?
-The script's approach is to first establish a solid understanding of the theoretical concepts, such as the correspondence between areas and scores, and then apply these concepts to non-standard normal distributions to find areas, probabilities, and corresponding x values in real-world data sets.
What does the script suggest will be the structure of the upcoming video lessons?
-The script suggests that the upcoming video lessons will be structured around the learning outcomes, starting with discussing the first learning outcome in the next video.
Outlines
📚 Lesson Overview of Real Applications of Normal Distributions
This paragraph introduces the video as a lesson overview for Lesson 6.2, focusing on the real-world applications of normal distributions. The content is based on Pearson slides modified to fit the course's textbook, 'Essentials of Statistics' by Mario Triola. The lesson is part of the broader chapter on continuous probability distributions, specifically revisiting normal distributions and the standard normal distribution. The paragraph outlines the learning outcomes, which include understanding the relationship between areas and scores in standard and non-standard normal distributions, converting x values to z scores and vice versa, and finding areas or probabilities for given ranges of x values in normally distributed continuous random variables. The key concept highlighted is the distinction between standard normal distributions, which have a mean of zero and a standard deviation of one, and non-standard normal distributions, which do not necessarily have these properties.
Mindmap
Keywords
💡Normal Distributions
💡Standard Normal Distribution
💡Continuous Probability Distributions
💡Z-Score
💡X Value
💡Area Under the Curve
💡Probability
💡Essentials of Statistics
💡Mario Triola
💡Pearson
💡Learning Outcomes
Highlights
Lesson 6.2 focuses on real applications of normal distributions.
The lesson is based on slides from Pearson, modified for the course.
This is the second section in a four-part series from Chapter 6 of 'Essentials of Statistics' by Mario Triola.
The previous section covered continuous probability distributions and the standard normal distribution.
Lesson 6.2 revisits non-standard normal distributions, which have different means and standard deviations from zero and one.
The learning outcomes include discussing the correspondence between areas and scores for standard and non-standard normal distributions.
The lesson will review formulas for converting x values to z scores and vice versa.
The material connects to previous discussions on measures of relative standing from Chapter 3.
The goal is to find areas corresponding to given ranges of x values in normal distributions.
The lesson will also find x values associated with known areas or probabilities.
The material builds on concepts previously introduced regarding standard normal distributions.
Non-standard normal distributions are defined by having means and standard deviations different from zero and one.
There are simple conversion formulas to relate standard and non-standard normal distributions.
Using these formulas allows finding areas, probabilities, and corresponding x values in non-standard distributions.
The lesson plan includes a discussion of the first learning outcome in the next video.
Transcripts
Browse More Related Video
6.2.1 Nonstandard Normal Distributions -Converting B/t Standard and Nonstandard Normal Distributions
6.1.0 The Standard Normal Distribution - Lesson Overview, Learning Outcomes

Elementary Statistics - Chapter 6 Normal Probability Distributions Part 1
6.1.3 The Standard Normal Distribution - Normal Dist. and Properties of the Standard Normal Dist.
6.1.4 The Standard Normal Distribution - Given a range of z scores, find areas or probabilities.
Z-Statistics vs. T-Statistics EXPLAINED in 4 Minutes
5.0 / 5 (0 votes)
Thanks for rating: