consumers' surplus Example
TLDRIn this video, we solve a question on consumer surplus using the given demand function for flowers: p = 40 - 2q. With the price set at $18, we find the equilibrium quantity and calculate the consumer surplus. The consumer surplus is the area above the equilibrium price and below the demand curve, which is determined by integrating the demand function and subtracting total expenditure. The final consumer surplus is calculated to be 121, which represents the benefit consumers receive from paying less than their maximum willingness to pay.
Takeaways
- 📚 The video discusses the concept of consumer surplus in the context of a demand function for flowers.
- 💐 The demand function is given as \( p = 40 - 2q \), where \( p \) is the price of a flower and \( q \) is the quantity of flowers.
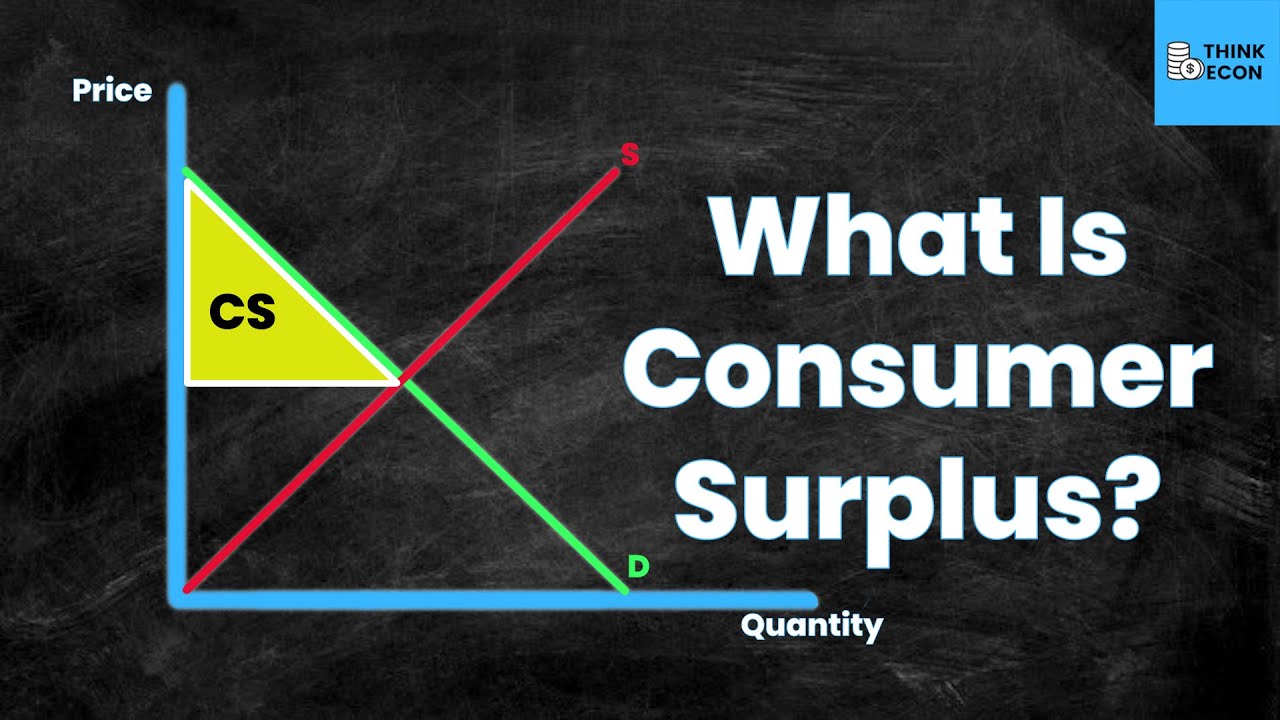
- 🔍 Consumer surplus is defined as the difference between the price a consumer pays and the price they are willing to pay for an item.
- 📈 The video explains that consumer surplus can be visualized graphically above the equilibrium price and below the demand curve.
- 💡 It's shown that at an equilibrium price of 18 dollars, the corresponding quantity is calculated to be 18 by substituting the price into the demand function.
- 🧩 The consumer surplus is the area above the equilibrium price and below the demand curve, which is to be calculated.
- 📝 The formula for calculating consumer surplus is presented as the definite integral of the demand function from 0 to the equilibrium quantity, minus the total expenditure.
- ✏️ The integral calculation involves integrating the demand function and subtracting the area under the price times quantity curve.
- 📊 The integral of the demand function from 0 to the equilibrium quantity is calculated, and the total expenditure is subtracted to find the consumer surplus.
- 🔢 The final calculation of consumer surplus is given as 121, which represents the area of the triangle formed above the equilibrium price.
- 📚 The video concludes by explaining that consumer surplus can also be understood as the area of a triangular shape on the graph, representing the surplus value to consumers.
Q & A
What is the main topic of the video?
-The main topic of the video is to solve a question related to consumer surplus, specifically for the demand function of flowers.
What is the given demand function for flowers in the video?
-The given demand function for flowers is p = 40 - 2q, where p is the price of the flower and q denotes the quantity of flowers.
What is consumer surplus and how is it determined?
-Consumer surplus is the difference between the price a consumer pays for an item and the price they would be willing to pay for it. It is determined graphically as the area above the equilibrium price and below the demand curve.
What is the equilibrium price of the flower in the video?
-The equilibrium price of the flower in the video is given as 18 dollars.
How is the equilibrium quantity of flowers calculated in the video?
-The equilibrium quantity is calculated by substituting the equilibrium price into the demand function, solving for q, which results in q = 18.
What is the method used to calculate the consumer surplus in the video?
-The consumer surplus is calculated using the definite integral of the demand function from 0 to the equilibrium quantity, minus the total expenditure (price multiplied by quantity).
What is the formula used to calculate the integral of the demand function in the video?
-The formula used is the integral of (40 - 2q) with respect to q, which simplifies to 40q - (q^2)/2.
How is the total expenditure calculated in the video?
-The total expenditure is calculated by multiplying the equilibrium price (18) by the equilibrium quantity (11), resulting in 198.
What is the final calculated consumer surplus in the video?
-The final calculated consumer surplus in the video is 121, which represents the area of the triangle formed above the equilibrium price and below the demand curve.
How is the consumer surplus graphically represented in the video?
-The consumer surplus is graphically represented as the area of a triangle formed by the demand curve, the equilibrium price, and the vertical axis.
Outlines
📚 Introduction to Consumer Surplus Calculation
This paragraph introduces the concept of consumer surplus in the context of a demand function for flowers. The demand function is given as p = 40 - 2q, where p is the price and q is the quantity. The video aims to calculate the consumer surplus when the price of a flower is $18. Consumer surplus is defined as the difference between what a consumer is willing to pay and what they actually pay. The paragraph explains the graphical representation of consumer surplus, which is the area above the equilibrium price and below the demand curve. The equilibrium quantity is calculated by substituting the given price into the demand function, resulting in q = 11. The consumer surplus is then described as the area under the demand curve from 0 to the equilibrium quantity, minus the total expenditure at the equilibrium price.
📈 Calculating Consumer Surplus Graphically and Mathematically
The second paragraph delves into the calculation of consumer surplus both graphically and mathematically. The graphical method involves identifying the area of a triangle formed by the demand curve, the equilibrium price, and the quantity axis. The mathematical approach involves calculating the definite integral of the demand function from 0 to the equilibrium quantity, minus the total expenditure (price times quantity) at the equilibrium. The integral calculation is detailed, showing the steps to find the area under the curve, and the total expenditure is subtracted to find the consumer surplus. The paragraph concludes with a numerical example, calculating the consumer surplus to be 121, which is the area of the triangle representing the surplus. The explanation also clarifies the graphical interpretation of consumer surplus by subtracting the area of the rectangle (total expenditure) from the trapezoidal area under the demand curve.
Mindmap
Keywords
💡Consumer Surplus
💡Demand Function
💡Equilibrium Price
💡Equilibrium Quantity
💡Total Expenditure
💡Definite Integral
💡Graphical Interpretation
💡Price
💡Quantity
💡Trapezoid
Highlights
The video explains how to calculate consumer surplus using a demand function for flowers.
The demand function for flowers is given as p = 40 - 2q, where p is the price and q is the quantity.
Consumer surplus is the difference between what a consumer pays and what they are willing to pay.
A graphical representation of consumer surplus is introduced, showing the area above the equilibrium price and below the demand curve.
The equilibrium price of 18 dollars is used to find the equilibrium quantity by substituting into the demand function.
The equilibrium quantity is calculated to be 18 by solving the equation 18 = 40 - 2q.
Consumer surplus is the area above the equilibrium price and below the demand curve, which is graphically represented.
The formula for calculating consumer surplus is introduced, involving the definite integral of the demand function minus total expenditure.
The definite integral of the demand function from 0 to the equilibrium quantity is calculated to find consumer surplus.
The integral calculation involves finding the antiderivative of the demand function and evaluating it at the equilibrium quantity.
The total expenditure is calculated as the product of the equilibrium price and quantity.
The consumer surplus is then found by subtracting the total expenditure from the integral of the demand function.
The final calculation of consumer surplus is presented, resulting in a numerical value.
An alternative method of calculating consumer surplus using graphical interpretation is briefly mentioned.
The area of a triangular shape above the equilibrium price represents the consumer surplus graphically.
The video concludes by summarizing the method of calculating consumer surplus and its graphical interpretation.
Transcripts


5.0 / 5 (0 votes)
Thanks for rating: