Consumers' Surplus , Producers' Surplus & Total Surplus from demand & supply Functions #PS
TLDRThis video from the mathematical economics series guides viewers through the process of calculating consumer and producer surplus. The presenter starts by equating the demand and supply functions to find the equilibrium price and quantity. Using the functions P = 32 - 8Q for demand and P = 12 + 2Q for supply, the equilibrium is determined at Q = 2 and P = 16. The script then explains how to calculate surpluses using definite integrals, resulting in a consumer surplus of 16 and a producer surplus of 4. The video concludes with a graphical representation of the surpluses, illustrating the areas under the respective curves.
Takeaways
- 📚 The video is part of a mathematical economics series focusing on calculating producer and consumer surplus.
- 🔍 The demand function given is \( P = 32 - 8Q \), where \( P \) is the price and \( Q \) is the quantity.
- 📉 The supply function is \( P = 12 + 2Q \), showing the relationship between price and quantity supplied.
- ⚖️ Equilibrium is found where the demand and supply functions intersect, calculated by setting them equal to each other.
- 🔢 The equilibrium quantity \( Q \) is found to be 2 by solving the equation from the intersection of demand and supply.
- 💰 The equilibrium price \( P \) is determined to be 16 by substituting the equilibrium quantity into the demand function.
- 🛒 Consumer surplus is the difference between what consumers are willing to pay and what they actually pay, calculated using definite integrals.
- 🏭 Producer surplus is the difference between the price producers are willing to supply at and the price they receive, also calculated using integrals.
- 📈 The script explains how to use integral calculus to find both consumer and producer surplus, involving the integration of demand and supply functions.
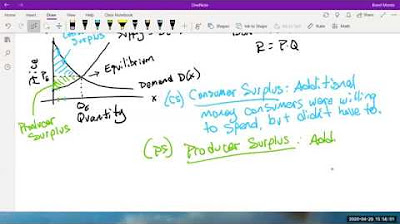
- 📊 Consumer surplus is represented by the area above the equilibrium price and below the demand curve, while producer surplus is the area below the supply curve and above the equilibrium price.
- 📚 The video concludes with a graphical depiction of the demand and supply curves, equilibrium points, and the areas representing consumer and producer surplus.
Q & A
What is the main topic of the video?
-The main topic of the video is to solve a numerical problem on finding consumer surplus and producer surplus in the context of mathematical economics.
What are the given demand and supply functions in the video?
-The given demand function is P = 32 - 8Q, where P is the price and Q is the quantity. The supply function is P = 12 + 2Q.
How is equilibrium quantity found in the video?
-Equilibrium quantity is found by setting the demand function equal to the supply function and solving for Q, which results in Q = 2.
What is the equilibrium price calculated in the video?
-The equilibrium price is calculated by substituting the equilibrium quantity (Q = 2) into the demand function, resulting in P = 16.
What is the total expenditure (P*Q) at equilibrium in the video?
-The total expenditure at equilibrium is calculated as 32, which is P (16) times Q (2).
How is consumer surplus defined in the video?
-Consumer surplus is defined as the difference between what consumers are willing to pay and what they actually pay, calculated using the definite integral of the demand function from 0 to the equilibrium quantity and subtracting the total expenditure.
What is the formula used to calculate consumer surplus in the video?
-The formula used to calculate consumer surplus is the definite integral from 0 to the equilibrium quantity of the demand function (32 - 8Q) with respect to Q, minus the total expenditure (P*Q).
What is the value of consumer surplus found in the video?
-The value of consumer surplus found in the video is 16.
How is producer surplus defined in the video?
-Producer surplus is defined as the difference between the price producers are willing to supply the good for and the price they actually receive, calculated using the definite integral of the supply function from 0 to the equilibrium quantity.
What is the formula used to calculate producer surplus in the video?
-The formula used to calculate producer surplus is the definite integral from 0 to the equilibrium quantity of the supply function (12 - 2Q) with respect to Q, subtracting the total revenue (P*Q) at equilibrium.
What is the value of producer surplus found in the video?
-The value of producer surplus found in the video is 4.
How are consumer surplus and producer surplus graphically represented in the video?
-Consumer surplus is represented by the area above the equilibrium price and below the demand curve, while producer surplus is represented by the area below the equilibrium price and above the supply curve.
Outlines
📚 Introduction to Consumer and Producer Surplus Calculation
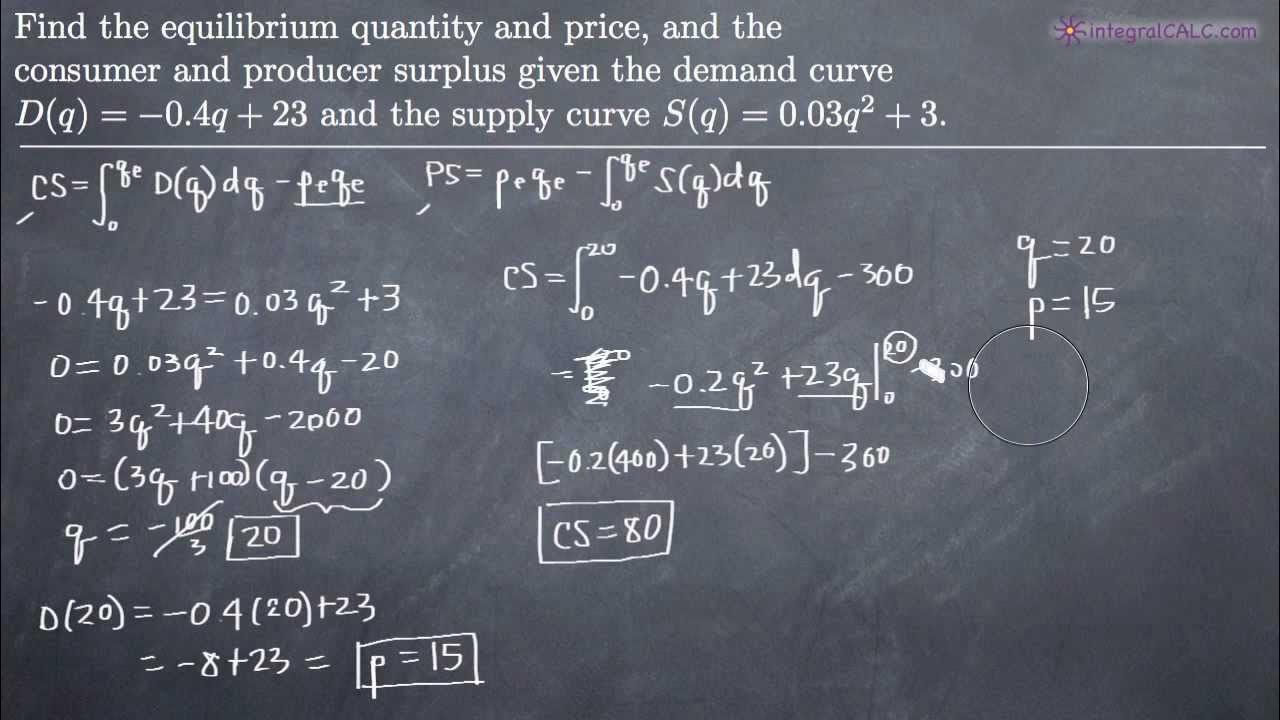
The video script begins an educational series on mathematical economics, focusing on calculating consumer and producer surplus. It introduces the demand function P = 32 - 8Q and the supply function P = 12 - 2Q, aiming to find the surpluses at equilibrium. The script explains the process of setting the demand equal to supply to find the equilibrium quantity Q, which is calculated to be 2. The equilibrium price P is then found by substituting Q back into either function, resulting in P = 16. The script emphasizes the importance of understanding equilibrium in economic models.
🧮 Calculating Consumer Surplus Using Definite Integrals
This paragraph delves into the calculation of consumer surplus, which is the difference between what consumers are willing to pay and what they actually pay. The script uses the definite integral to find this surplus by integrating the demand function from 0 to the equilibrium quantity, subtracting the total expenditure (P*Q). The integral calculation is shown step by step, leading to a consumer surplus of 16. The explanation includes the evaluation of the integral at the upper and lower limits, demonstrating the mathematical process involved in economic analysis.
📉 Deriving Producer Surplus with Supply Function Integration
The script continues with the calculation of producer surplus, which is the difference between the price producers are willing to accept and the actual price received. Similar to consumer surplus, the producer surplus is calculated using a definite integral of the supply function from 0 to the equilibrium quantity, subtracting the total revenue (P*Q). The integral of the supply function is detailed, and the process of evaluating the integral at the limits is explained, resulting in a producer surplus of 4. This section reinforces the application of calculus in economic surplus analysis.
📈 Graphical Representation of Consumer and Producer Surplus
The script provides a graphical representation of the consumer and producer surplus, plotting the demand and supply functions on a price-quantity graph. It explains how to identify the equilibrium point where the demand and supply curves intersect and how to visualize the surplus areas. The consumer surplus is depicted as the area above the equilibrium price and below the demand curve, while the producer surplus is the area below the equilibrium price and above the supply curve. This visual aid helps in understanding the economic concepts of surplus in a more intuitive manner.
🔍 Recap and Summary of Surplus Calculation Process
The final paragraph recaps the entire process of finding consumer and producer surplus, starting from equating the demand and supply functions to find the equilibrium quantity and price. It summarizes the calculation of total expenditure, consumer surplus as an integral of the demand function, and producer surplus as an integral of the supply function. The script concludes by reiterating the graphical representation of surpluses and the total surplus as the sum of consumer and producer surplus, encapsulating the key takeaways from the video.
Mindmap
Keywords
💡Producer Surplus
💡Consumer Surplus
💡Demand Function
💡Supply Function
💡Equilibrium
💡Definite Integral
💡Total Expenditure
💡Total Revenue
💡Law of Demand
💡Law of Supply
Highlights
Introduction to solving numerical problems in mathematical economics, specifically finding producer and consumer surplus.
Given demand function P = 32 - 8Q and supply function P = 12 + 2Q, where P is price and Q is quantity.
Equilibrium is found where the demand and supply functions intersect, leading to the solution for quantity Q.
Equation setup for equilibrium: 32 - 8Q = 12 + 2Q, solved to find Q = 2.
Calculation of equilibrium price by substituting Q = 2 into the demand function, resulting in P = 16.
Explanation of consumer surplus as the difference between what consumers are willing to pay and what they actually pay.
Use of definite integrals to calculate consumer surplus, integrating the demand function from 0 to Q.
Consumer surplus calculation involves integrating the demand function and subtracting total expenditure.
Result of consumer surplus calculation is 16, representing the area between the demand curve and the equilibrium price.
Producer surplus is the difference between the price producers are willing to supply and the actual price received.
Producer surplus is calculated using the supply function and the equilibrium price.
Definite integral of the supply function from 0 to Q is used to find the producer surplus.
Producer surplus result is 4, indicating the area between the supply function and the equilibrium price.
Graphical representation of consumer and producer surplus on a demand and supply graph.
Total surplus is the sum of consumer and producer surplus, representing the overall economic benefit.
Recap of the process from given functions to finding equilibrium and calculating surpluses.
Emphasis on the practical application of mathematical methods in economic analysis.
Transcripts
Browse More Related Video
Consumer and Producer Surplus (KristaKingMath)
consumer surplus and producer surplus

How to Calculate Producer Surplus and Consumer Surplus from Supply and Demand Equations | Think Econ
Consumers 'surplus Producers' Surplus , Total surplus, deadweight loss with price floor
Math 11 - Section 5.1

Consumer-Producer Surplus (p. 476 #10 )
5.0 / 5 (0 votes)
Thanks for rating: