What is Consumer Surplus? | Think Econ | Microeconomic Concepts
TLDRThis video delves into the concept of consumer surplus in welfare economics, illustrating how it represents the benefit consumers gain when they pay less than their willingness to pay. Using a supply and demand graph, the video explains the demand curve's role in determining consumers' reservation price and the surplus they receive when the market price is lower. The yellow triangle on the graph visualizes the consumer surplus, highlighting the value consumers place on goods and the extra money saved when the price is less than their maximum willingness to pay.
Takeaways
- 📈 Economic welfare refers to the benefits that consumers or producers receive by participating in the market.
- 💸 Consumer surplus is the benefit consumers receive when they pay a price lower than what they were willing to pay.
- 📊 Consumer surplus can be illustrated on a supply and demand graph by examining the demand curve.
- 🔄 The demand curve is downward sloping due to the law of demand, indicating that as price decreases, quantity demanded increases.
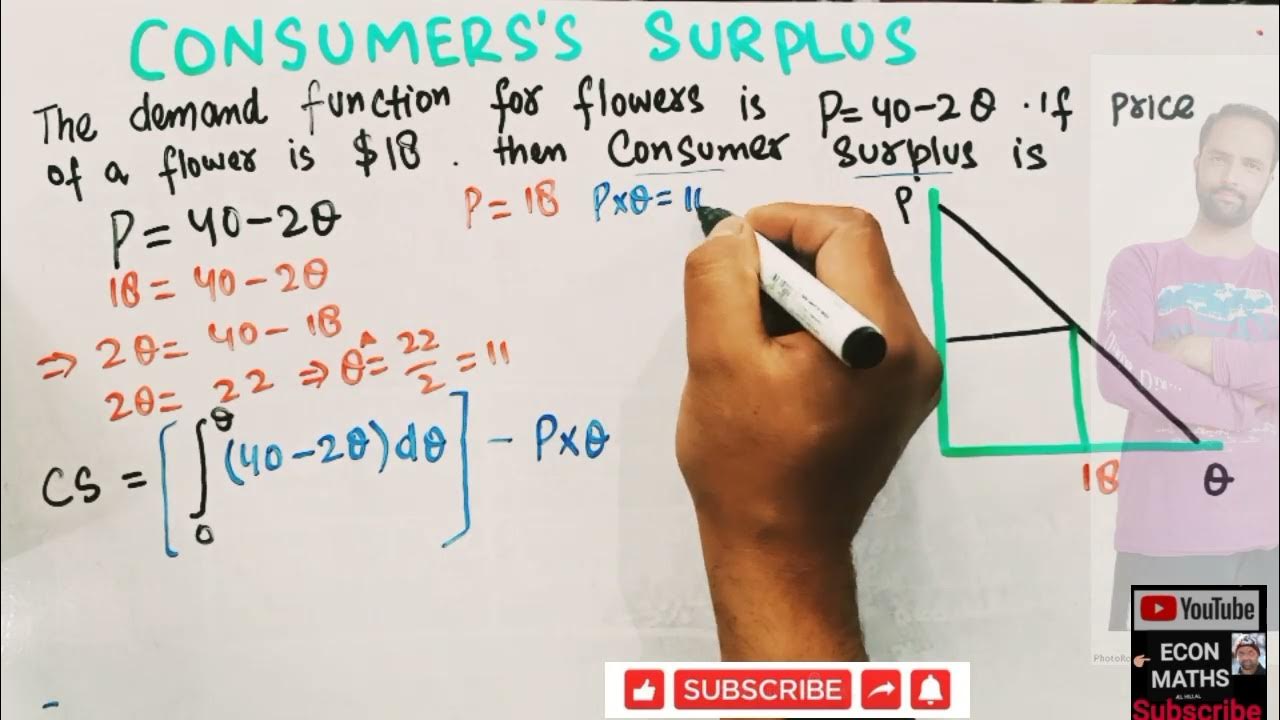
- 🛒 Consumer surplus is represented by the area under the demand curve but above the equilibrium price.
- 💰 A consumer's reservation price is the highest price they are willing to pay for a good, reflecting its value to them.
- 🥤 If a good is sold for less than the reservation price, the difference is the consumer surplus.
- 🔍 On a graph, consumer surplus is the triangle area below the demand curve and above the selling price.
- 📐 The value of the consumer surplus can be calculated mathematically, typically by finding the area of the triangle.
- 📹 Future videos will cover the detailed mathematical calculations for determining consumer surplus.
Q & A
What is economic welfare in the context of the video?
-Economic welfare refers to the benefits that consumers or producers receive by participating in the market, such as buying and selling goods.
Can you define consumer surplus as explained in the video?
-Consumer surplus is the benefit that customers receive when they pay a price that is less than what they were willing to pay for a good or service.
How is the demand curve represented in the video?
-The demand curve is represented as downward sloping due to the law of demand, showing the relationship between the price and the quantity of goods that consumers are willing to buy.
What does the equilibrium price (p star) represent in the context of consumer surplus?
-The equilibrium price (p star) is the market price at which the quantity demanded by consumers equals the quantity supplied by producers, and it serves as the base for calculating consumer surplus.
Outlines
📈 Introduction to Consumer Surplus and Economic Welfare
The video script begins with an introduction to the concept of economic welfare, which encompasses the benefits that consumers and producers gain from market participation. The focus then narrows to 'consumer surplus,' which is the advantage consumers experience when they pay less than the price they are willing to pay. A supply and demand graph is used to illustrate this concept, with an emphasis on the demand curve to represent the value consumers place on a good and their willingness to pay. The equilibrium price (p star) and quantity (q star) are introduced as reference points, and the script hints at a future video that will delve into the calculation of consumer surplus.
🛒 Understanding Consumer Surplus through a Demand Curve
This paragraph delves deeper into the concept of consumer surplus by examining the demand curve as a reflection of consumers' willingness to pay for a product. It introduces the term 'reservation price,' which is the maximum price a consumer is willing to pay for a good. Using the example of a family-sized bag of Doritos, the script explains how consumer surplus is created when the actual purchase price is lower than the reservation price. The script also describes how to visually identify consumer surplus on a graph, highlighting it as the area under the demand curve but above the market price (p star), forming a triangular shape. The explanation emphasizes the value consumers associate with goods and how surplus represents the extra money left in their pockets when they pay less than their maximum willingness to pay.
Mindmap
Keywords
💡Economic Welfare
💡Consumer Surplus
💡Demand Curve
💡Equilibrium Price
💡Reservation Price
💡Supply Curve
💡Law of Demand
💡Graphical Representation
💡Value
💡Surplus
Highlights
Introduction to the concept of consumer surplus in welfare economics.
Economic welfare as the benefits derived from market participation.
Consumer surplus is the benefit received when customers pay less than their willingness to pay.
Visual representation of consumer surplus on a supply and demand graph.
Explanation of the law of demand and its impact on the demand curve.
Equilibrium price (p star) and quantity (q star) in the context of consumer surplus.
The demand curve as an indicator of consumers' willingness to pay.
Transcripts
Browse More Related Video


5.0 / 5 (0 votes)
Thanks for rating: