Monopoly: Consumer Surplus, Producer Surplus, Deadweight Loss
TLDRThis video script guides through the process of calculating consumer surplus, producer surplus, and deadweight loss under a monopoly scenario. It begins with identifying the profit-maximizing output and price for a monopolist with a given inverse demand function and marginal cost equation. The script then explains how to graphically represent these concepts, compute the areas of consumer and producer surplus, and determine the deadweight loss, providing a step-by-step approach to economic analysis.
Takeaways
- 📈 The video explains how to calculate consumer surplus, producer surplus, and deadweight loss under a monopoly scenario.
- 🔢 The given inverse demand function is 130 - 0.5Q, where P is the price and Q is the quantity.
- 📉 The marginal cost function for the monopolist is 2Q + 10, indicating the cost of producing each additional unit.
- 💰 To find the profit-maximizing output level, the marginal revenue (derivative of total revenue) is set equal to the marginal cost, resulting in Q = 40 units.
- 🔑 Setting Q = 40 in the inverse demand function gives the profit-maximizing price of P = 110 dollars.
- 📊 The video suggests using a graphical approach to visualize consumer surplus, producer surplus, and deadweight loss.
- 📐 Consumer surplus is calculated as the area of a triangle formed by the demand curve and the actual price paid, resulting in $400.
- 📏 Producer surplus is the area between the price received by the monopolist and the marginal cost curve, totaling $2400.
- 🔍 Deadweight loss is identified as the area where consumers are willing to pay more than the cost to produce, calculated as a triangle with a base of 20 and a height of 8, resulting in a loss of $80.
- 📚 The video emphasizes the importance of understanding the graphical representation of economic concepts for clarity and ease of calculation.
- 📉 The marginal revenue curve is steeper than the inverse demand curve, reflecting the additional revenue gained from selling an extra unit.
Q & A
What is the inverse demand function given in the video?
-The inverse demand function given in the video is 130 - 0.5Q, where P is the price and Q is the quantity produced.
What is the marginal cost equation for the monopolist?
-The marginal cost equation for the monopolist is 2Q + 10.
How is the total revenue of the monopolist calculated?
-The total revenue of the monopolist is calculated by substituting the inverse demand function into the price times quantity formula, resulting in the expression 130Q - 0.5Q^2.
What is the marginal revenue and how is it derived?
-The marginal revenue is the derivative of the total revenue function, which is derived by differentiating the total revenue equation and simplifies to 130 - Q.
What is the profit-maximizing output level for the monopolist?
-The profit-maximizing output level for the monopolist is 40 units, found by setting marginal revenue equal to marginal cost.
What price will the monopolist set to maximize profit?
-The monopolist will set a price of 110 dollars to maximize profit, by plugging the profit-maximizing quantity of 40 into the inverse demand equation.
How is consumer surplus calculated under monopoly?
-Consumer surplus under monopoly is calculated as the area of a triangle, with the formula 1/2 * base * height. In this case, it is 1/2 * (130 - 110) * 40, resulting in $400.
What is the formula for calculating the area of a rectangle in terms of consumer surplus?
-The area of a rectangle is calculated as width times length. In the context of consumer surplus, it is the price the monopolist sells the good for minus the marginal cost times the quantity sold.
How is producer surplus calculated in the given scenario?
-Producer surplus is calculated by dividing the area between the price and the marginal cost curve into a rectangle and a triangle, calculating the area of each separately and summing them up. The rectangle's area is 20 * 40, and the triangle's area is 1/2 * 80 * 40, totaling $2400.
What is the deadweight loss and how is it calculated?
-Deadweight loss is the loss of economic efficiency due to market failure, calculated as the area of a triangle representing the difference between what consumers are willing to pay and the cost to produce. It is calculated as 1/2 * (price when P = MC) * (Q where P = MC - quantity sold), resulting in $80.
How can you find the quantity where price equals marginal cost?
-You find the quantity where price equals marginal cost by setting the inverse demand function equal to the marginal cost equation and solving for Q. In this case, 130 - 0.5Q = 10 + 2Q, which gives Q = 48.
Outlines
📈 Calculating Monopoly Profit and Prices
This paragraph introduces the concept of finding consumer surplus, producer surplus, and deadweight loss under a monopoly scenario. The monopolist's inverse demand function and marginal cost equation are given, and the process to determine the profit-maximizing output level and price is outlined. The total revenue is derived from the inverse demand function, and marginal revenue is calculated as its derivative. The profit-maximizing point is found by equating marginal revenue to marginal cost, resulting in an output of 40 units and a price of $110. The paragraph concludes with an introduction to graphical analysis for further exploration of consumer and producer surpluses.
📊 Analyzing Consumer and Producer Surpluses and Deadweight Loss
The second paragraph delves into the graphical representation and calculation of consumer surplus, producer surplus, and deadweight loss in a monopoly market. Consumer surplus is identified as the area between the demand curve and the price paid by consumers up to the quantity sold. It is calculated using the formula for the area of a triangle, resulting in a consumer surplus of $400. Producer surplus is the area between the price received by the monopolist and the marginal cost curve, which is divided into a rectangle and a triangle for calculation, yielding a total producer surplus of $2400. Deadweight loss is the area representing the difference between what consumers are willing to pay and the cost to produce additional units, calculated as a triangle with a base of 20 and a height of 8, resulting in a deadweight loss of $80. The paragraph provides a step-by-step explanation of how to find each of these economic measures under monopoly conditions.
Mindmap
Keywords
💡Consumer Surplus
💡Producer Surplus
💡Deadweight Loss
💡Monopoly
💡Inverse Demand Function
💡Marginal Cost
💡Total Revenue
💡Marginal Revenue
💡Profit Maximization
💡Graphical Analysis
Highlights
Introduction to the task of finding consumer surplus, producer surplus, and deadweight loss under monopoly conditions.
The given inverse demand function is 130 - 0.5Q, where P is price and Q is quantity.
Marginal cost equation provided as 2Q + 10 for the monopolist.
Explanation of how to find the profit-maximizing output level and price for a monopolist.
Total revenue is calculated by substituting the inverse demand function into the revenue formula.
Derivation of marginal revenue from the total revenue function.
Setting marginal revenue equal to marginal cost to find the profit-maximizing quantity of 40 units.
Calculation of the price at which the monopolist sells the product, which is $110.
Graphical representation of the firm's demand and marginal cost curves.
Identification of consumer surplus as the area of a triangle formed under the demand curve.
Calculation of consumer surplus using the dimensions of the triangle (400).
Producer surplus is defined as the difference between the price and marginal cost up to the quantity sold.
Division of producer surplus into a rectangle and a triangle for area calculation.
Calculation of the rectangle's area contributing to producer surplus (800).
Calculation of the triangle's area contributing to producer surplus (1600), totaling 2400.
Introduction to the concept of deadweight loss in the context of monopoly.
Deadweight loss is calculated as the area of a triangle representing units where consumers' willingness to pay exceeds production cost.
Final calculation of deadweight loss as $80.
Transcripts
Browse More Related Video
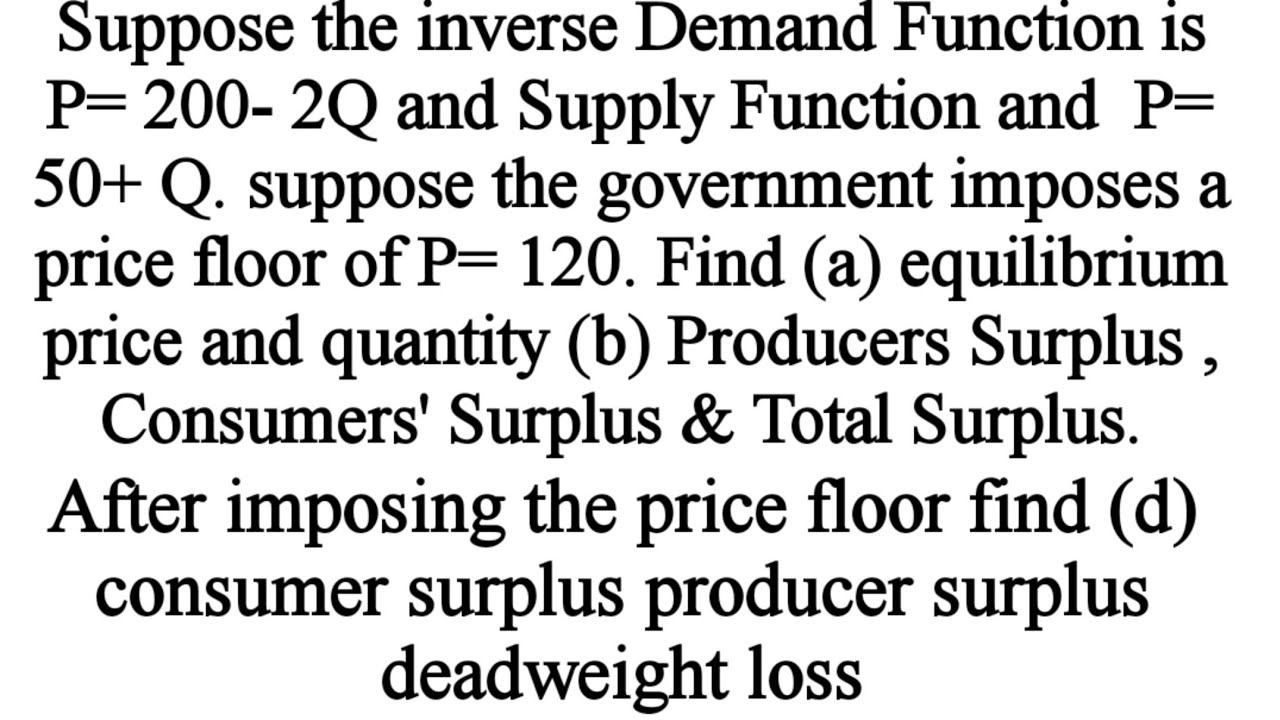
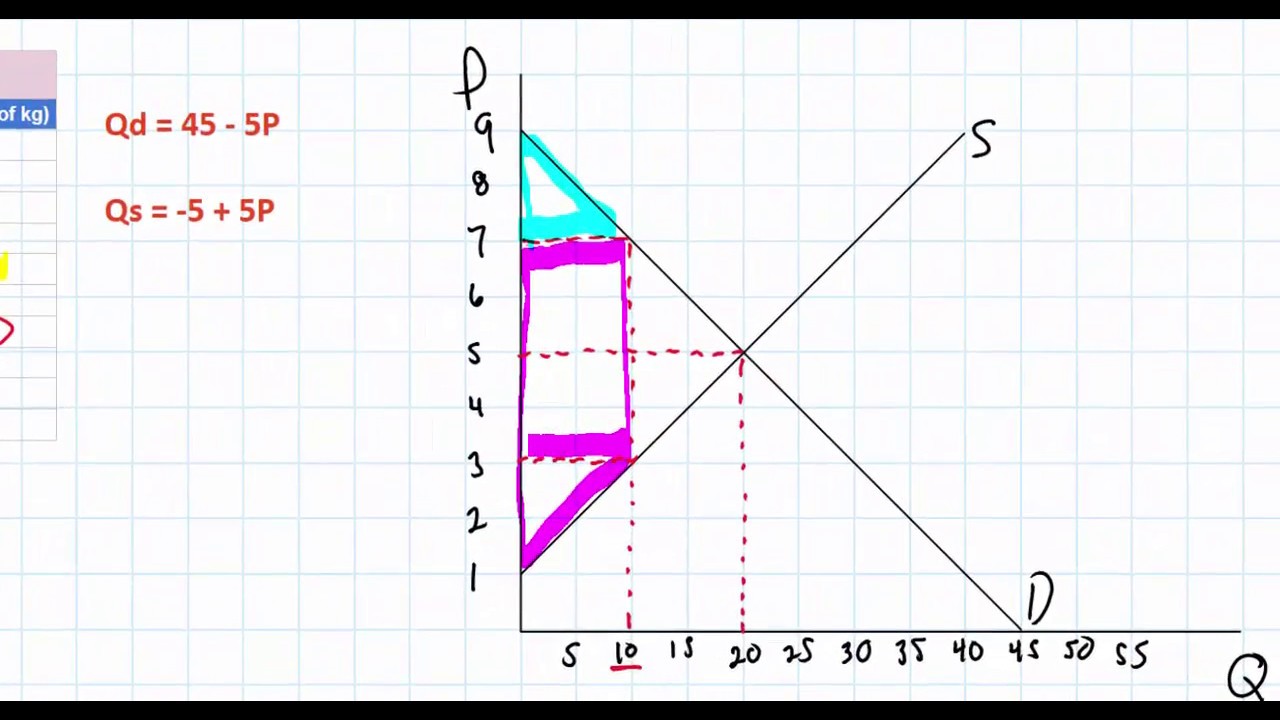
Consumers 'surplus Producers' Surplus , Total surplus, deadweight loss with price floor
Calculating the area of Deadweight Loss (welfare loss) in a Linear Demand and Supply model
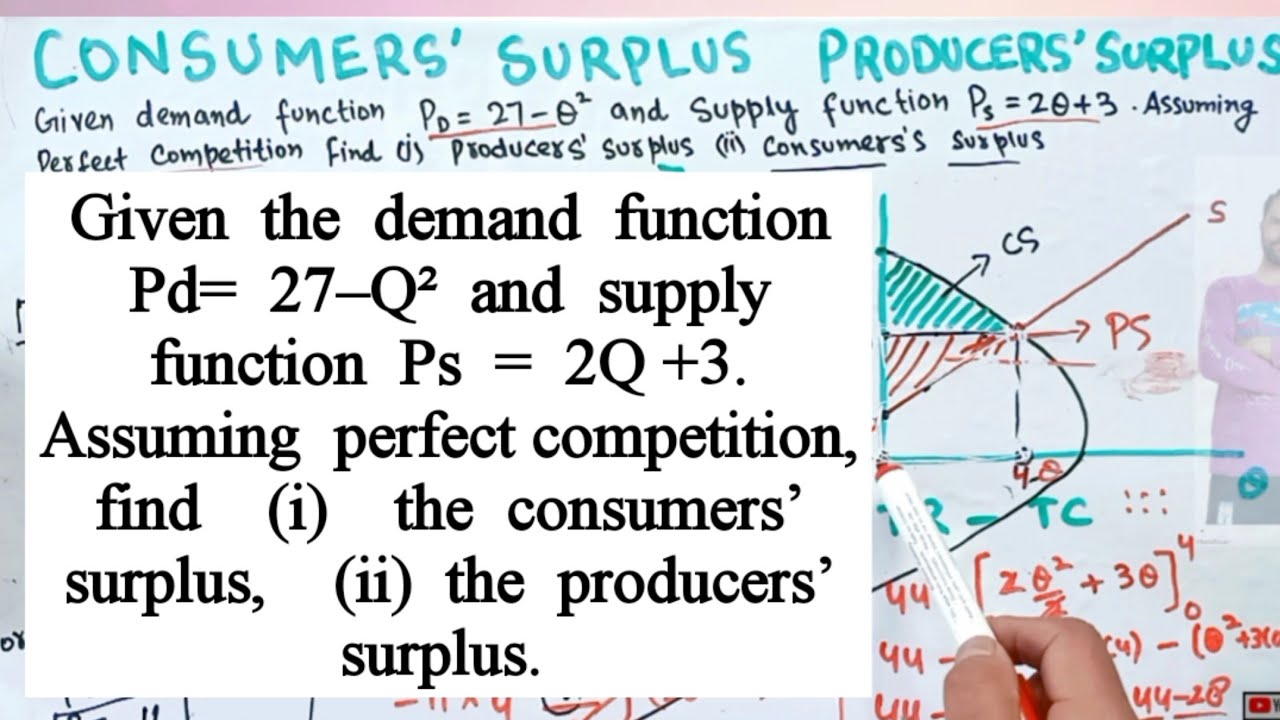
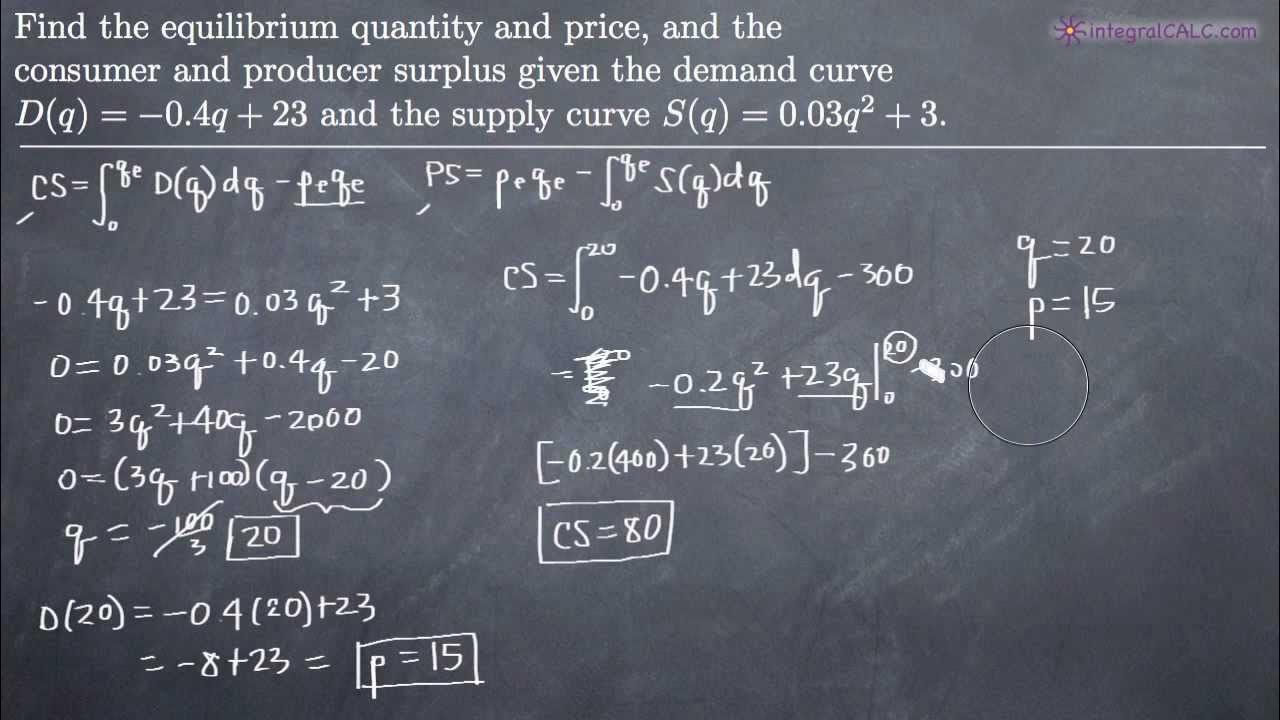
Consumers' Surplus Producers' Surplus from given Demand and Supply functions
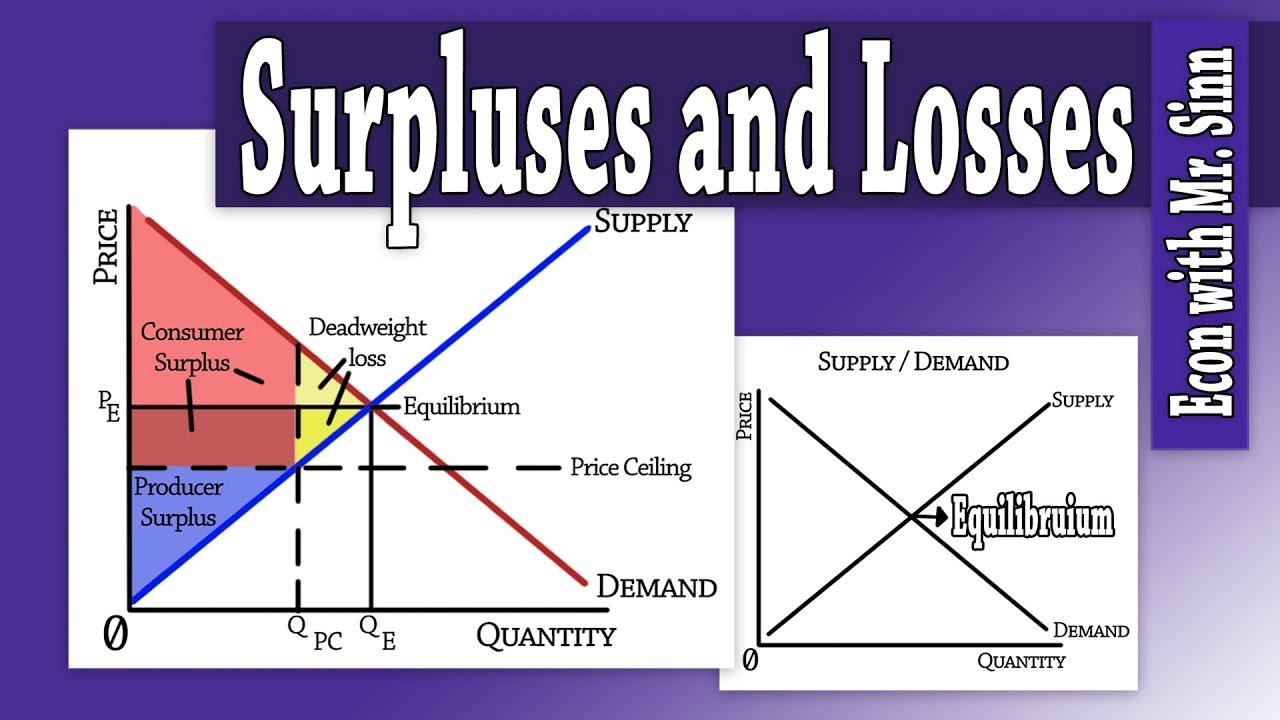
Consumer/Producer Surplus & Deadweight Loss
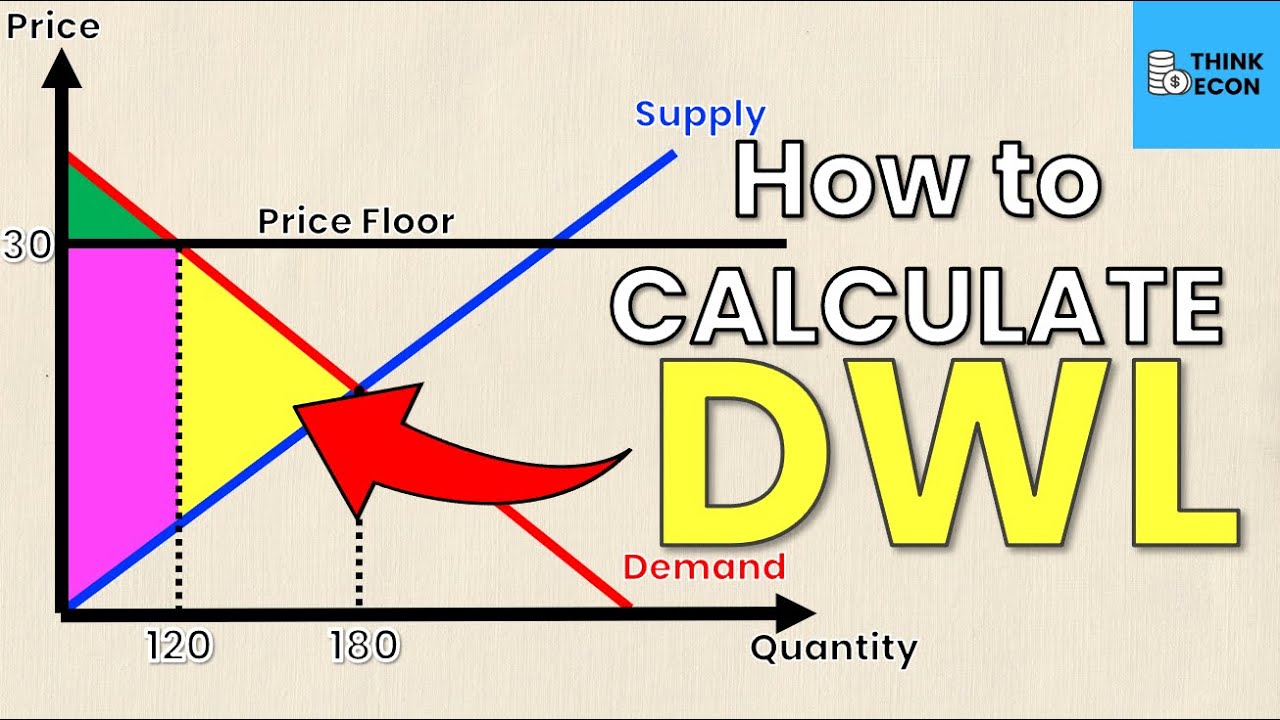
How to Calculate Deadweight Loss (with a Price Floor) | Think Econ
Consumer and Producer Surplus (KristaKingMath)
5.0 / 5 (0 votes)
Thanks for rating: