Consumer/Producer Surplus & Deadweight Loss
TLDRIn this informative video, Mr. Sin discusses the economic concepts of consumer surplus, producer surplus, and deadweight loss, using the example of rubber ducks. He explains how these surpluses are represented graphically on a supply and demand chart and how government interventions like price floors and ceilings can distort the market equilibrium, leading to inefficiencies and deadweight loss. The video aims to clarify these concepts for viewers, encouraging them to engage with the material and ask questions.
Takeaways
- 📈 Consumer Surplus: The difference between what consumers are willing to pay and what they actually pay, represented by the area above the market price and below the demand curve.
- 📉 Producer Surplus: The difference between what producers are willing to sell for and the actual selling price, indicated by the area below the market price and above the supply curve.
- 📊 Equilibrium Price: The price at which the quantity supplied equals the quantity demanded, in this case, $10 for rubber ducks.
- 🔍 Total Surplus: The sum of consumer surplus and producer surplus, showing the total value created in a transaction, represented by the combined area of the two surplus triangles.
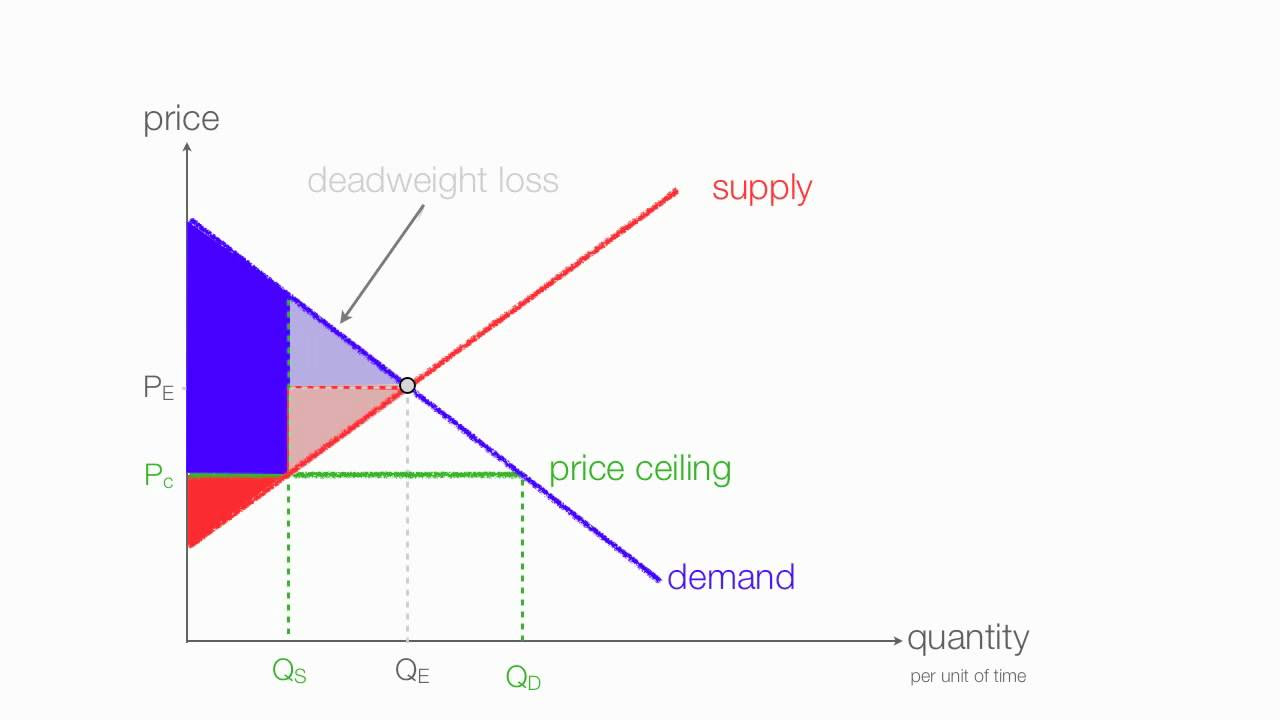
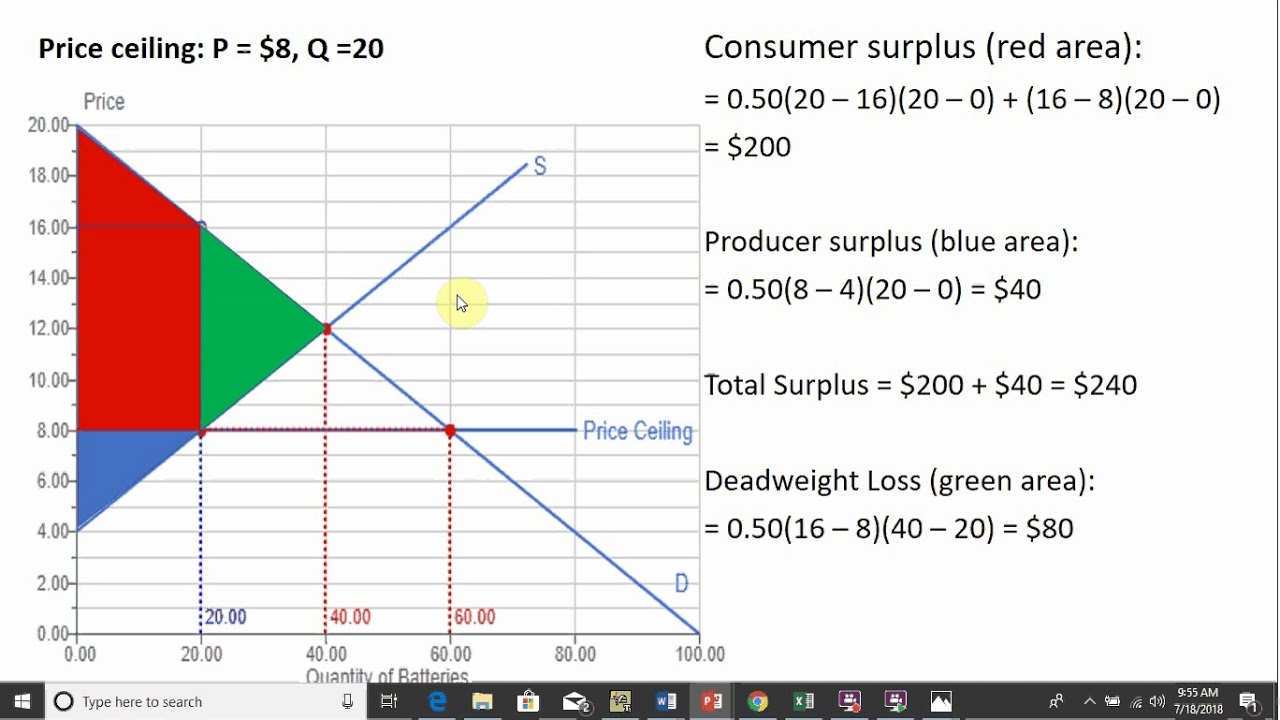
- 🏢 Price Ceiling: A government-imposed maximum price that sellers can charge, which in the script is set at $7, leading to a shortage.
- 🛒 Price Floor: A government-imposed minimum price that sellers can charge, set at $12 in the script, resulting in a surplus.
- 📉 Deadweight Loss: The inefficiency and loss of value caused by market manipulation, such as price ceilings or floors, shown as the area between the equilibrium and the imposed price.
- 📚 Importance of Understanding: The video emphasizes the importance of understanding price floors and ceilings before diving into concepts like deadweight loss.
- 📝 Guided Notes: The script mentions the availability of guided notes in the description to help viewers follow along with the video content.
- 📉 Market Manipulation: Artificially lowering or raising prices through government regulation can lead to market imbalances, such as shortages or surpluses.
- 🤔 Impact on Consumers and Producers: Changes in market prices due to government intervention can affect both consumers and producers, potentially leading to a loss of surplus for both parties.
Q & A
What is the main topic of the video?
-The main topic of the video is to explain the concepts of consumer surplus, producer surplus, and deadweight loss in the context of price floors and price ceilings.
What should viewers understand before watching the video?
-Viewers should have an understanding of what a price floor and price ceiling are before watching the video.
What is consumer surplus?
-Consumer surplus is the difference between what consumers are willing to pay and what they actually pay for a product.
How is consumer surplus represented on a supply and demand chart?
-On a supply and demand chart, consumer surplus is represented by the area above the market price and below the demand curve up to the point where the price would have been without the price control.
What is producer surplus?
-Producer surplus is the difference between what producers are willing to accept for a product and the actual price at which they sell it.
How is producer surplus represented on a supply and demand chart?
-Producer surplus is represented by the area below the market price and above the supply curve up to the point where the price would have been without the price control.
What is total surplus?
-Total surplus is the sum of consumer surplus and producer surplus, representing the total value created in a market transaction.
What is a price ceiling and how does it affect the market?
-A price ceiling is a government-imposed maximum price that can be charged for a product. It can lead to a shortage and a decrease in both consumer and producer surplus, resulting in deadweight loss.
What is deadweight loss and how is it represented on a supply and demand chart?
-Deadweight loss is the reduction in total surplus due to market inefficiency caused by price controls. It is represented by the area between the original equilibrium price and the price control where no transactions occur.
What is a price floor and how does it differ from a price ceiling?
-A price floor is a government-imposed minimum price that can be charged for a product. Unlike a price ceiling, which sets a maximum price, a price floor can lead to a surplus and also results in deadweight loss.
What is the potential consequence of artificially lowering prices through government regulation as mentioned in the script?
-The potential consequence is a shortage of goods, as the artificially lowered prices can lead to reduced supply and increased demand, ultimately causing some consumers to be unable to purchase the product.
What does the script suggest about the impact of market manipulation by the government?
-The script suggests that market manipulation by the government can lead to inefficiencies and a loss of potential gains from trade, as represented by the deadweight loss.
Outlines
📈 Introduction to Consumer and Producer Surplus
The video script introduces the economic concepts of consumer surplus, producer surplus, and deadweight loss. It begins with a greeting and an invitation to the channel, followed by a brief explanation of these concepts. The script emphasizes the importance of understanding price floors and ceilings before delving into surpluses and loss. It uses a supply and demand chart for rubber ducks to illustrate equilibrium at $10, where six ducks are sold. Consumer surplus is defined as the difference between what consumers are willing to pay and what they actually pay, while producer surplus is the difference between what producers are willing to accept and what they actually receive. The script guides viewers to follow along with charts and notes for better understanding.
🏛️ Impact of Price Ceilings and Floors on Surplus and Deadweight Loss
This paragraph discusses the effects of government-imposed price ceilings and floors on the market. It uses the example of a price ceiling set at $7 for rubber ducks, which is below the equilibrium price, leading to an increase in demand and a decrease in supply. The new consumer and producer surpluses are represented by different areas on the supply and demand chart. The script explains that deadweight loss occurs due to market manipulation, resulting in lost efficiency and a shortage of goods. The concept is further illustrated with a hypothetical scenario where a price floor is set at $12, above the equilibrium, causing a surplus of goods and another instance of deadweight loss. The video concludes by encouraging viewers to ask questions and subscribe for more content.
Mindmap
Keywords
💡Consumer Surplus
💡Producer Surplus
💡Deadweight Loss
💡Price Floor
💡Price Ceiling
💡Equilibrium Price
💡Supply and Demand Chart
💡Market Manipulation
💡Total Surplus
💡Economic Efficiency
Highlights
Introduction to the concepts of consumer surplus, producer surplus, and deadweight loss in the context of market economics.
The importance of understanding price floors and price ceilings before discussing deadweight loss.
Explanation of consumer surplus as the difference between what consumers are willing to pay and what they actually pay.
Illustration of consumer surplus on a supply and demand chart for rubber ducks at an equilibrium price of $10.
Clarification that consumers below the equilibrium point are not factored into consumer surplus calculations.
Introduction of producer surplus as the difference between what producers are willing to accept and the actual selling price.
Identification of producer surplus on the supply side of the supply and demand chart below the equilibrium.
Explanation that producers willing to sell at higher prices above the equilibrium are not part of producer surplus.
Calculation of total surplus by adding consumer surplus and producer surplus together.
Scenario of a government-imposed price ceiling below the market equilibrium leading to a change in supply and demand.
Impact of a price ceiling on consumer and producer surplus, and the introduction of deadweight loss.
Deadweight loss as the lost efficiency due to market manipulation by government regulation.
Illustration of deadweight loss on a supply and demand chart as the area representing lost potential transactions.
Hypothetical scenario of a price floor imposed above the market equilibrium and its effects on consumer and producer surplus.
Deadweight loss under a price floor scenario and its representation on the supply and demand chart.
The potential consequences of market manipulation, such as shortages and inefficiencies.
Encouragement for viewers to ask questions in the comments for further clarification.
Closing remarks with an invitation to subscribe and explore other videos on the channel.
Transcripts
Browse More Related Video
How to calculate changes in consumer and producer surplus with price and floor ceilings.

Price floors and surplus
Consumers 'surplus Producers' Surplus , Total surplus, deadweight loss with price floor
Price Ceiling: Consumer Surplus, Producer Surplus, & Deadweight loss

Micro: Unit 1.6 -- Consumer Surplus, Producer Surplus, and Deadweight Loss

Intermediate Microeconomics: Consumer surplus, producer surplus, price controls, and taxes, Part 1
5.0 / 5 (0 votes)
Thanks for rating: