Phase Diagrams | Gibbs Phase Rule (w/ 5 Examples)
TLDRIn this video from Catalyst University, Kevin Tokeoff explains the Gibbs Phase Rule, a crucial concept in physical chemistry. He breaks down the equation 2 + C - P = F, where C represents components, P phases in equilibrium, and F intensive variables that can change independently. Using phase diagrams, Kevin illustrates how different points relate to univariant, invariant, and divariant equilibria, emphasizing how changes in pressure and temperature affect the equilibrium state. This clear and thorough explanation simplifies a complex topic, making it accessible and understandable.
Takeaways
- 😀 The video is a part of the Physical Chemistry series on Catalyst University by Kevin.
- 📚 The main topic discussed in the video is the Gibbs Phase Rule, a fundamental concept in phase diagrams.
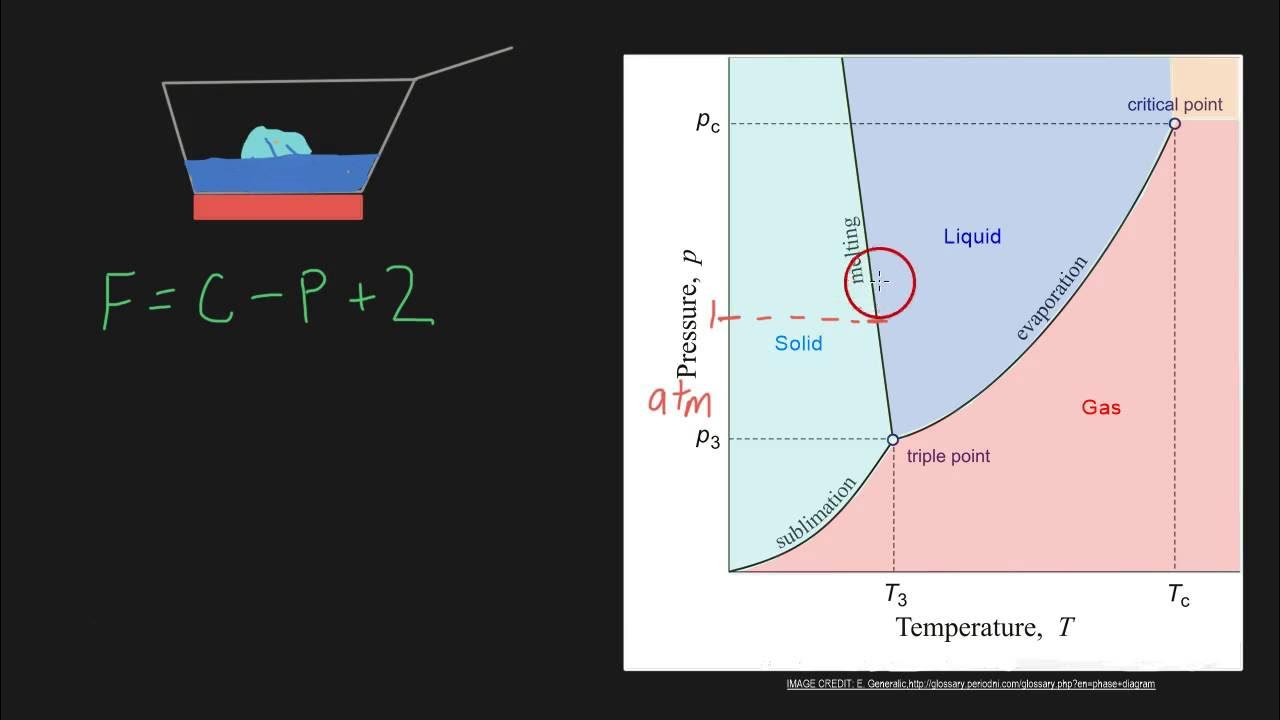
- 🔍 The Gibbs Phase Rule is expressed by the equation \( F = C + 2 - P \), where \( C \) is the number of components, \( P \) is the number of phases in equilibrium, and \( F \) is the number of degrees of freedom.
- 🧩 The number of components (\( C \)) refers to the different types of molecules in a mixture or solution.
- 🌡 The number of phases in equilibrium (\( P \)) is determined by looking at specific points on the phase diagram.
- 🔄 The degrees of freedom (\( F \)) represent the number of intensive variables that can be changed independently without affecting the equilibrium of phases.
- 🔒 An \( F = 0 \) indicates an invariant equilibrium, where neither pressure nor temperature can be changed without disturbing the phase equilibrium.
- 🔄 An \( F = 1 \) signifies a univariant equilibrium, allowing for changes in either pressure or temperature with a compensatory change in the other to maintain equilibrium.
- 🆓 An \( F = 2 \) represents a divariant equilibrium, where pressure and temperature can be changed independently without affecting the phase equilibrium.
- 📉 The video uses examples of phase diagrams to illustrate how to determine the value of \( F \) and the type of equilibrium for different points on the diagram.
- 🤓 The video emphasizes that understanding phase diagrams and correctly interpreting the number of phases in equilibrium is key to applying the Gibbs Phase Rule effectively.
Q & A
What is the main topic of the video?
-The main topic of the video is the Gibbs phase rule in the context of physical chemistry, which is used to determine the number of degrees of freedom in a system at equilibrium.
Who is the presenter of the video?
-The presenter of the video is Kevin, from Catalyst University.
What is the equation for the Gibbs phase rule?
-The equation for the Gibbs phase rule is F = C + 2 - P, where F is the number of degrees of freedom, C is the number of components in the mixture, and P is the number of phases in equilibrium.
What does C represent in the Gibbs phase rule equation?
-In the Gibbs phase rule equation, C represents the number of components in the mixture, which is essentially the number of different types of molecules present.
What does P represent in the Gibbs phase rule equation?
-In the Gibbs phase rule equation, P represents the number of phases in equilibrium, which is determined by looking at a specific point on the phase diagram.
What is an example of a phase with one component?
-An example of a phase with one component is pure water, which contains only one type of molecule and thus is considered to have one component.
What is an example of a phase with two components?
-An example of a phase with two components is a mixture of water and ethanol, where each substance represents a separate component.
What does F represent in the Gibbs phase rule equation?
-In the Gibbs phase rule equation, F represents the number of intensive variables that can be changed independently without disturbing the number of phases in equilibrium.
What are the three types of equilibria described in the video?
-The three types of equilibria described in the video are invariant equilibrium (F = 0), univariant equilibrium (F = 1), and divariant equilibrium (F = 2).
What is a triple point in the context of phase diagrams?
-A triple point in the context of phase diagrams is a point where three phases are in equilibrium with each other, such as solid, liquid, and gas.
What does it mean when F equals zero in the Gibbs phase rule?
-When F equals zero in the Gibbs phase rule, it indicates an invariant equilibrium, where neither pressure (P) nor temperature (T) can be changed without disturbing the number of phases in equilibrium.
What does it mean when F equals one in the Gibbs phase rule?
-When F equals one in the Gibbs phase rule, it indicates a univariant equilibrium, where either pressure or temperature can be changed, but the other must change correspondingly to maintain the number of phases in equilibrium.
What does it mean when F equals two in the Gibbs phase rule?
-When F equals two in the Gibbs phase rule, it indicates a divariant equilibrium, where pressure and temperature can be changed independently of each other without affecting the number of phases in equilibrium.
How can you determine the number of components in a phase diagram if it's not explicitly stated?
-If the number of components is not explicitly stated, you initially assume there is one component. You then apply the Gibbs phase rule and if the calculated F value is negative, you increase the number of components by one and recalculate until F is non-negative.
What is the significance of the green dot in the video's phase diagram example?
-The green dot in the video's phase diagram example represents a point of univariant equilibrium, where the system is in contact with two different phases, and pressure or temperature must be changed correspondingly to maintain this equilibrium.
What is the significance of the blue dot in the video's phase diagram example?
-The blue dot in the video's phase diagram example represents a point of divariant equilibrium, where the system is in the center of a phase area, and either pressure or temperature can be changed independently without affecting the equilibrium.
What is the significance of the red dot in the video's phase diagram example?
-The red dot in the video's phase diagram example represents a point of invariant equilibrium, which is typically found at a triple point where three phases are in equilibrium, and neither pressure nor temperature can be changed without disturbing this equilibrium.
Outlines
📚 Introduction to Gibbs Phase Rule
In this introductory segment, the host, Kevin, welcomes viewers back to the Physical Chemistry series on Catalyst University. He emphasizes the importance of liking and subscribing for updates on future videos. The main topic of discussion is the Gibbs Phase Rule, a fundamental concept in understanding phase diagrams. Kevin introduces the rule with the equation '2 + C - P = F' and explains the variables: C for the number of components in a mixture, P for the number of phases in equilibrium, and F for the degrees of freedom in changing intensive variables without altering the equilibrium. The segment sets the stage for a deeper dive into phase diagrams and their complexities.
🔍 Exploring Gibbs Phase Rule with Examples
This paragraph delves into applying the Gibbs Phase Rule with practical examples. It begins with the assumption of a single component in the mixture, which simplifies the calculation of F. The host uses different colored points on a phase diagram to illustrate various scenarios: the green dot representing a univariant equilibrium where pressure (P) and temperature (T) must change in tandem, the blue dot indicating a divariant equilibrium allowing independent changes in P or T, and the red dot at the triple point, which is an invariant equilibrium where neither P nor T can be altered without disrupting the equilibrium. These examples clarify how to determine the type of equilibrium based on the values of C, P, and F.
🧩 Advanced Application of Gibbs Phase Rule
The host introduces a more complex phase diagram involving a light blue point, which initially appears to present a calculation error with a negative F value. By reassessing the number of components (C) in the mixture, Kevin demonstrates how to correct the equation to reflect an invariant equilibrium, similar to the triple point scenario. He then discusses the purple point, which, with the assumption of two components, results in a divariant equilibrium. This section highlights the importance of accurately interpreting phase diagrams and the flexibility in changing variables while maintaining phase equilibrium.
📢 Conclusion and Call to Action
In the concluding remarks, the host summarizes the key takeaways from the video, reinforcing the utility of the Gibbs Phase Rule in analyzing phase diagrams. He encourages viewers to engage with the content by liking the video and subscribing to the channel for more educational content. The host's call to action serves as a reminder of the ongoing series and the value of continued learning in physical chemistry.
Mindmap
Keywords
💡Physical Chemistry
💡Phase Diagrams
💡Clausius-Clapeyron Equation
💡Gibbs Phase Rule
💡Components
💡Phases
💡Equilibrium
💡Intensive Variables
💡Invariant Equilibrium
💡Univariant Equilibrium
💡Divariant Equilibrium
Highlights
Introduction to the concept of phase diagrams and the Gibbs phase rule.
Explanation of the Gibbs phase rule formula: 2 + C - P = F.
Definition of 'C' as the number of components in a mixture.
Clarification on how to determine the number of components in a mixture, such as pure water or a mixture of water and ethanol.
Definition of 'P' as the number of phases in equilibrium at a specific point on a phase diagram.
Illustration of how to identify phases in equilibrium using colored points on a phase diagram.
Introduction to 'F' as the number of intensive variables that can be changed without disturbing the equilibrium.
Explanation of invariant equilibrium (F = 0) where neither pressure nor temperature can be changed.
Description of univariant equilibrium (F = 1) where pressure or temperature can be changed with a compensatory change in the other to maintain equilibrium.
Discussion of divariant equilibrium (F = 2) where pressure and temperature can be changed independently.
Use of the Gibbs phase rule to determine the type of equilibrium for different points on a phase diagram.
Example of calculating F for a green dot representing a two-phase equilibrium.
Explanation of how to handle a situation where F appears to be negative by adjusting the number of components.
Application of the Gibbs phase rule to a more complex phase diagram with multiple components.
Analysis of a light blue point indicating a quadruple point with four phases in equilibrium.
Clarification on the adjustment of the number of components to resolve a negative F value.
Example of calculating F for a purple point with two components and two phases in equilibrium.
Emphasis on the importance of correctly interpreting phase diagrams for accurate application of the Gibbs phase rule.
Conclusion summarizing the process of using the Gibbs phase rule and its practical applications.
Transcripts
Browse More Related Video


5.0 / 5 (0 votes)
Thanks for rating: