Beautiful data visualisation in Home Assistant
TLDRThis video explores various ways to enhance Home Assistant with visually appealing graphs and charts, transforming the user interface from basic to sophisticated. It covers the installation and customization of several Lovelace UI components, including Mini Graph Card for minimalistic designs, Apex Charts Card for more advanced visualizations, Plotty Graph Card for dynamic charts, and Sunkey Chart for power usage analysis. The tutorial also touches on the Horseshoe Flexible Card for unique data representation. The script guides viewers through the process of adding these components to Home Assistant, emphasizing the importance of reading documentation for advanced customization and visual data analysis.
Takeaways
- 🏠 Home assistants are commonly associated with smart home automation, but they can also be used to create visual data representations through graphs and charts.
- 📈 Home Assistant has built-in capabilities for basic graphing with 'History Graph' and 'Statistics Graph', but they may not be aesthetically pleasing.
- 📊 'Mini Graph Card' is a custom graphic component that can be added to Home Assistant to create cleaner and more visually appealing historical graphs.
- 🔍 To install 'Mini Graph Card', users can download it from repositories and then reload the Home Assistant UI to integrate it.
- 🛠 For customization and advanced graphing, 'Apex Charts Card' offers more complex and visually appealing options, including line and bar charts.
- 📚 Documentation is crucial when working with new UI components; it provides installation procedures, usage instructions, and examples.
- 🔬 'Plotty Graph Card' is another option for dynamic charts and graphs, offering interactive features like zooming and panning for detailed data analysis.
- 🌐 'Sunkey Chart' is ideal for visualizing power usage or production, allowing users to see the contribution of different devices to total energy consumption.
- 🔧 'Horseshoe Flexible Card' is not a typical graph card but offers customization for representing various values in a unique visual format.
- 👨💻 YAML code is often used for configuring and customizing these cards, and users are encouraged to explore examples and documentation for advanced setups.
- 🌟 The Home Assistant Community Store (HACS) significantly expands the options for data visualization, making it a valuable resource for enhancing the Home Assistant experience.
Q & A
What is the primary association people have when they hear 'home assistant'?
-The primary association people have when they hear 'home assistant' is usually smart home or home automation.
Why are graphs not the first thing that comes to mind when discussing home assistants?
-Graphs are not the first thing that comes to mind when discussing home assistants because the focus is typically on smart home devices and automation rather than data visualization.
What is the purpose of using data from smart home devices and sensors?
-The purpose of using data from smart home devices and sensors is to make automations and to make the house smarter, as well as to analyze and visually represent the data through graphs and charts.
What are the limitations of the embedded charts and graphs in Home Assistant?
-The embedded charts and graphs in Home Assistant, namely the history graph and statistics graph, are not very aesthetically pleasing and offer limited customization options.
What is a 'Mini Graph Card' and how does it improve the Home Assistant UI?
-A 'Mini Graph Card' is a custom graphics component for the Home Assistant UI that allows for the creation of minimalistic and visually appealing historical graphs, improving the look of the previously plain historical graphs.
How can one install the Mini Graph Card in Home Assistant?
-To install the Mini Graph Card, one needs to press on the plus sign, explore, and download repositories, type in 'mini', select 'Mini Graph Card', and download it. It's important to reload the page to clear the browser cache.
What is HACS and how does it relate to the installation of UI components like the Mini Graph Card?
-HACS (Home Assistant Community Store) is a platform for finding and installing community-created resources for Home Assistant, including UI components like the Mini Graph Card. It facilitates the discovery and management of these components.
What are the different types of graphs that can be created with the Apex Charts Card?
-The Apex Charts Card allows for the creation of various types of graphs, including line charts, bar charts, radial bar, pie, donut, and scatter charts, providing more advanced and customizable data visualization options.
What is unique about the Plotty Graph Card for dynamic charts in Home Assistant?
-The Plotty Graph Card is unique for its dynamic nature, allowing users to zoom in, zoom out, auto scale, and pan through the graphs, offering an interactive way to explore data within Home Assistant.
How can one visualize complex data correlations using the available graph cards?
-One can visualize complex data correlations by using the advanced features of the graph cards like the Apex Charts Card or the Plotty Graph Card, which allow for the combination and comparison of different data sets on the same graph.
What is the Sunkey Chart Card and how can it be used in Home Assistant?
-The Sunkey Chart Card is used for visualizing power usage or production, where it can represent the combined value of multiple devices or sensors as a percentage of the total consumption or production, providing a clear overview of energy distribution.
What is the purpose of the Flexible Horseshoe Card and how can it be customized?
-The Flexible Horseshoe Card is a versatile component that, while not a typical graph card, can be used to represent any values in Home Assistant. It can be customized by changing attributes such as the scale, color stops, and units to fit the data being visualized.
Why is it recommended to read the documentation after installing a new graph card?
-Reading the documentation is recommended because it provides detailed instructions on how to use the card, including examples and advanced configurations, helping users to get the most out of the graph card's capabilities.
Outlines
🏠 Introduction to Home Assistant and Graphs
Home Assistant is commonly associated with smart homes and automation, but it can also incorporate graphs for data visualization. This paragraph introduces the idea of adding aesthetically pleasing graphs to Home Assistant, despite its default graphs (history and statistics) being less visually appealing. The mini graph card is highlighted as a way to enhance the appearance of historical data graphs.
📊 Installing and Using Apex Charts in Home Assistant
Apex Charts is introduced as an advanced and visually appealing option for creating graphs in Home Assistant. The paragraph explains how to install the Apex Charts card and create a custom graph by editing the YAML code. It emphasizes the importance of referring to the documentation and examples provided on the GitHub repository for more advanced configurations.
🔍 Exploring Plotly for Dynamic Graphs
Plotly is presented as a powerful tool for creating dynamic and interactive charts in Home Assistant. The paragraph covers the installation process and basic usage, including zooming and panning features. It also stresses the need to read the documentation for advanced configurations and demonstrates how to correlate data like humidity and temperature using Plotly.
📈 Sunkey Charts and Horseshoe Cards for Advanced Visualization
The Sunkey Chart is discussed as an excellent tool for visualizing nested data like power usage. The installation and basic setup are explained, along with an example of visualizing power consumption in different parts of a home. The paragraph also introduces the flexible Horseshoe card for customizable visual representations, despite its lack of a typical graph structure. It concludes by emphasizing the importance of HACs for enhanced data visualization in Home Assistant and thanking the viewers.
Mindmap
Keywords
💡Home Assistant
💡Smart Home
💡Data Visualization
💡Automations
💡Mini Graph Card
💡HACS (Home Assistant Community Store)
💡YAML
💡Apex Charts Card
💡Plotty
💡Sunkey Chart
💡Horseshoe Card
Highlights
Home Assistant can integrate with various types of graphs and charts to visually represent data.
Smart home devices and sensors provide data that can be analyzed and visually represented.
Home Assistant has built-in charts like history graph and statistics graph, but they are not visually appealing.
Mini Graph Card is a custom graphics component that enhances the visual appeal of historical data.
Apex Charts Card offers more advanced and visually attractive graph options for correlating data.
Plotty Graph Card provides dynamic charts with interactive features like zoom and scroll.
Sunkey Chart is useful for visualizing power usage or production with nested device data.
Horseshoe Card is a flexible component that can represent various values beyond typical graph cards.
Installing Mini Graph Card involves downloading from repositories and reloading the Home Assistant UI.
Apex Charts Card requires manual YAML code entry for customization beyond the UI editor's capabilities.
Plotty Graph Card introduces interactive graph features, enhancing user engagement with data.
Sunkey Chart allows for the representation of energy consumption as a percentage from different devices.
Horseshoe Card can be customized to represent non-temperature data with various visual configurations.
Documentation for Home Assistant UI components is essential for advanced setup and customization.
Examples and documentation on GitHub are crucial for setting up and customizing various graph cards.
HACS (Home Assistant Community Store) significantly expands the options for data visualization in Home Assistant.
The video provides a comprehensive guide on integrating and customizing various graph cards in Home Assistant.
Transcripts
Browse More Related Video
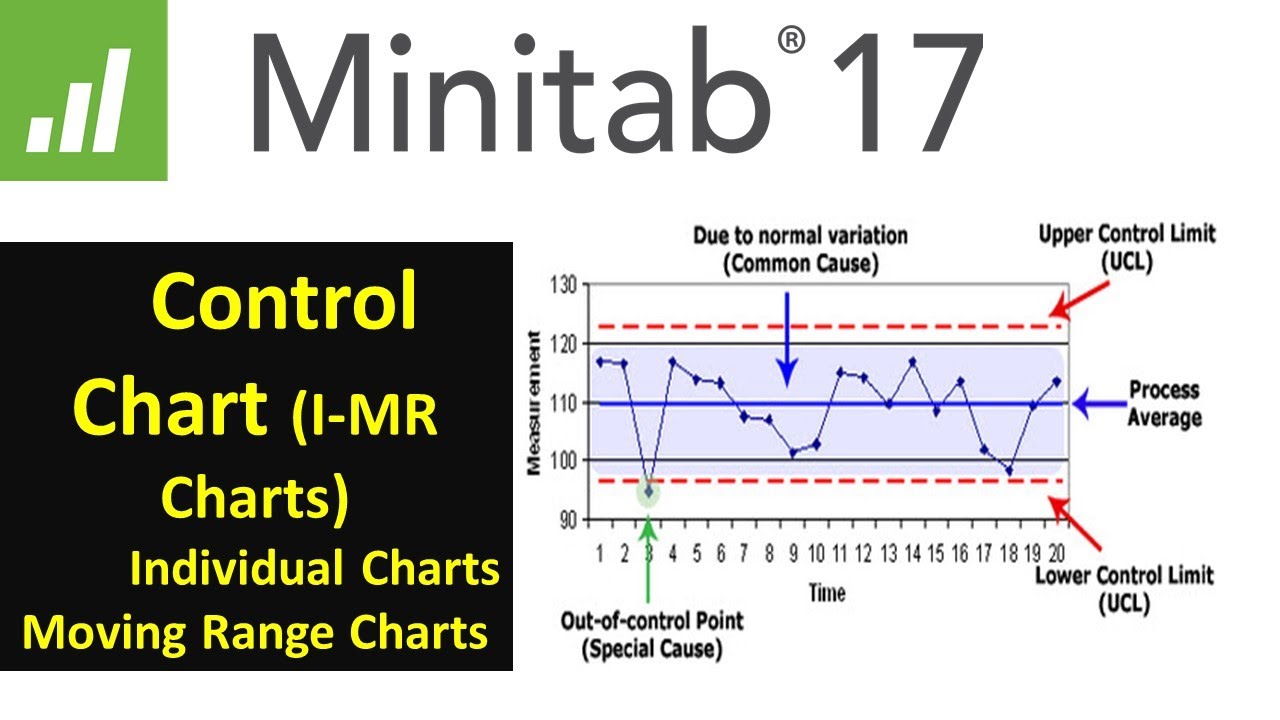
Statistical Process Control | SPC Control charts (IMR ) using Minitab 17 |

System statistics, automatic entities lists & device counters in Home Assistant
Stacked and Grouped Bar Charts and Mosaic Plots in R |R Tutorial 2.6| MarinStatsLectures

Google Sheets Tutorial for Beginners

Improve your UI in Home Assistant with 4 HACS components
INSANE STATISTICS In Home Assistant With Grafana! - TUTORIAL
5.0 / 5 (0 votes)
Thanks for rating: