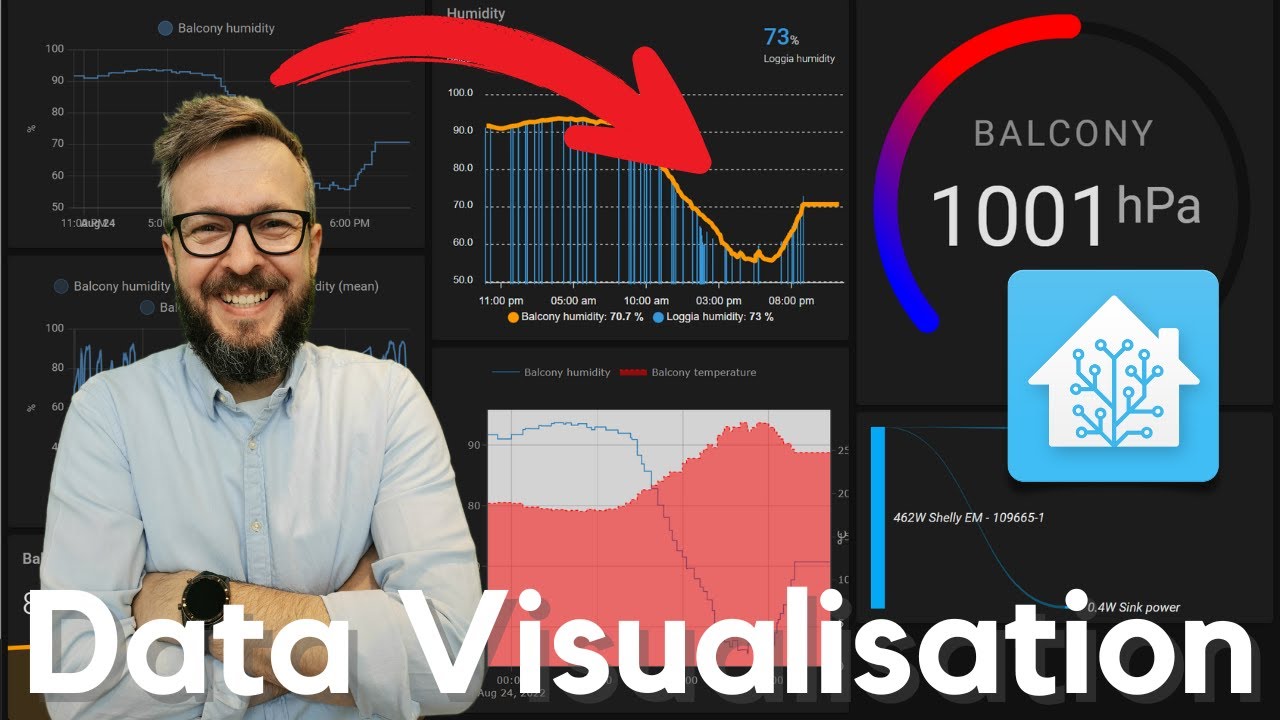
INSANE STATISTICS In Home Assistant With Grafana! - TUTORIAL
TLDRThis tutorial video walks viewers through setting up and utilizing Havana, a Grafana environment, to display Home Assistant statistics in a visually appealing manner. The host guides the audience step-by-step, starting with the installation and setup of InfluxDB, a time-series database, followed by connecting it to Home Assistant. They then demonstrate creating a database, user, and configuring Home Assistant to feed data into InfluxDB. Afterward, the video shows how to install Grafana, connect it to the InfluxDB, and create custom dashboards with various panels to visualize different aspects of home data, such as temperature, humidity, and energy consumption. The host emphasizes the flexibility and numerous possibilities of Grafana for gaining insights into home performance.
Takeaways
- 🏠 The video introduces how to use Havana, a Grafana environment, to visualize Home Assistant statistics in an appealing way.
- 🔧 The first step is to set up InfluxDB through Home Assistant's supervisor and add-on store by searching for and installing InfluxDB.
- ⏳ InfluxDB installation and startup may take some time, and progress can be monitored via the logs.
- 🗂️ After InfluxDB is up, a database and user need to be created within InfluxDB for Home Assistant to store data.
- 🔗 To link InfluxDB with Home Assistant, specific configuration details must be added to the `configuration.yaml` file.
- 📊 InfluxDB can be used to create basic graphs, but Grafana (referred to as Havana in the script) allows for more advanced and visually appealing graphics.
- 🔄 After configuring InfluxDB, Home Assistant needs to be restarted for the changes to take effect and start populating the database with data.
- 📈 Grafana is installed and connected to the InfluxDB data source to display the data in customizable dashboards.
- 🛠️ Grafana dashboards consist of multiple panels that can be customized to show different types of statistics and graphs.
- 🌡️ The video demonstrates creating a panel to show the living room temperature and other statistics such as rain data and solar panel production.
- 👀 The script showcases various example dashboards including weather, energy consumption, and system performance monitoring.
Q & A
What is the purpose of using Havana with Home Assistant?
-Havana is used with Home Assistant to visualize statistics in a more appealing and comprehensive way than the default history view.
What is InfluxDB and why is it used in this setup?
-InfluxDB is a time-series database that is used to store and retrieve data for the Home Assistant statistics. It's an essential component for collecting data that will be visualized in Grafana.
How do you install InfluxDB using Home Assistant's supervisor?
-You go to the supervisor, then to the add-on store, search for InfluxDB, and install it by clicking 'Install'. After installation, you start InfluxDB and monitor the log for its startup progress.
What are the steps to create a database and user in InfluxDB?
-You need to access the InfluxDB admin interface, create a database with a name like 'home assistant', create a user with a username and password, and assign the necessary permissions to that user.
How do you connect Home Assistant to InfluxDB?
-You need to edit Home Assistant's configuration.yaml file to include the InfluxDB details such as the host name, database name, username, and password, and then restart Home Assistant.
What is Grafana and how does it relate to InfluxDB?
-Grafana is an open-source platform for monitoring and observability. It connects to InfluxDB to retrieve data and allows users to create comprehensive and interactive visualizations of that data.
How do you install Grafana in Home Assistant?
-You go to the supervisor, access the add-on store, search for Grafana, and install it. After installation, you start Grafana and add it to your sidebar for easy access.
What is the process of adding a data source in Grafana?
-In Grafana, you go to Configuration > Data Sources, add a new data source, select InfluxDB, provide a name, the InfluxDB URL, database name, and credentials, then save and test the connection.
How do you create a new dashboard in Grafana?
-In Grafana, you go to the dashboards section, click on 'Create Dashboard', and then start adding panels with different visualizations and statistics based on the data from InfluxDB.
What kind of visualizations can you create in Grafana?
-In Grafana, you can create various types of visualizations such as graphs, bar charts, line charts, and more to represent different kinds of data and statistics.
How can you customize the panels in Grafana?
-You can customize panels in Grafana by selecting different measurements, changing the panel title, choosing the type of visualization, and adjusting the color and other display options.
Outlines
🤖 Setting Up InfluxDB for Home Assistant Statistics
The video script introduces the process of using Grafana, known as Havana, to visualize Home Assistant statistics. The first step involves setting up InfluxDB through Home Assistant's supervisor add-on store. The installation and starting process of InfluxDB are described, including troubleshooting a 'bad gateway' error by patiently waiting for the service to become available. Once InfluxDB is running, the script guides the viewer to create a database named 'home assistant' and a user with the same name and permissions to access this database. The goal is to allow Home Assistant to store its data in InfluxDB for later visualization.
🔧 Configuring InfluxDB and Grafana Integration
This paragraph details the process of configuring Home Assistant to connect with InfluxDB. It involves editing the 'configuration.yaml' file and adding specific code to establish the connection, which includes the hostname and credentials for the InfluxDB instance. After saving the changes, Home Assistant needs to be restarted for the updates to take effect. The script then explains how to check InfluxDB for the newly recorded data from Home Assistant and mentions the potential to create various graphs and visualizations in InfluxDB. The paragraph concludes with the installation and setup of Grafana, which will be used to create more advanced visualizations.
📊 Creating Dashboards in Grafana for Home Assistant
The script moves on to creating dashboards in Grafana by first adding InfluxDB as a data source. It provides a step-by-step guide on configuring the data source with the correct URL, database name, username, and password. After successfully connecting Grafana to InfluxDB, the viewer is shown how to create a new dashboard and add panels with different types of visualizations, such as graphs and bar meters, to display data like living room temperature and rainfall. The paragraph emphasizes the flexibility and customization options available in Grafana for creating various panels and visualizing data from Home Assistant.
🌡️ Customizing Grafana Dashboards for Comprehensive Home Monitoring
The final paragraph showcases the capabilities of Grafana by demonstrating how to create and customize dashboards for monitoring various aspects of a home. It includes examples of panels that display weather conditions, power consumption, energy production from solar panels, and system performance metrics like CPU usage and temperature. The script highlights the flexibility of Grafana in adjusting the time range for data visualization, from daily to monthly views. The tutorial concludes with an invitation for viewers to explore and create their own dashboards to gain insights into their home's performance, and a prompt for viewers to like, subscribe, and stay tuned for more content.
Mindmap
Keywords
💡Home Assistant
💡Hafana
💡InfluxDB
💡Supervisor
💡Data Visualization
💡Configuration.yaml
💡Entities
💡Dashboards
💡Data Source
💡Smart Home
💡Integration
Highlights
Introduction to using Havana with Home Assistant for displaying statistics.
Setting up InfluxDB through Home Assistant's supervisor and add-on store.
Starting InfluxDB and monitoring its progress through the log.
Creating a database and user in InfluxDB for Home Assistant data.
Configuring Home Assistant to connect with InfluxDB using the configuration.yaml file.
Instructions on adding specific code to connect InfluxDB to Home Assistant.
Restarting Home Assistant to apply changes and check InfluxDB for data.
Creating various graphs and visualizations within InfluxDB.
Installing and starting Grafana to create advanced graphics.
Connecting Grafana to the InfluxDB database as a data source.
Creating a new dashboard and panels in Grafana for different statistics.
Demonstration of creating a temperature graph for a living room in Grafana.
Exploring the flexibility of Grafana for creating custom dashboards.
Example dashboards showcasing weather, power consumption, and system metrics.
Instructions on creating a bar meter and graph for current temperature and rain data.
Customizing Grafana panels with titles, colors, and graph types.
The ability to view and analyze long-term data trends in Grafana.
Closing remarks and call to action for likes, subscriptions, and notifications.
Transcripts
Browse More Related Video

Home Assistant Templates - A Beginner's Guide

Home Assistant How To - get more Statistics from sensors

Create your OWN Template Sensor with Home Assistant Coding Tutorial

ZHA or Zigbee2MQTT - that's the question now!

Beautiful data visualisation in Home Assistant

Templates and Custom Sensors in Home Assistant - How To TUTORIAL
5.0 / 5 (0 votes)
Thanks for rating: