Graphing Functions on a TI-84 Calculator - Lesson 2
TLDRIn this informative video, Steve Soboc owner of Amy, Flashcards dcom, introduces viewers to the process of graphing various types of functions using a TI-84 graphics calculator. He demonstrates how to modify line types and colors, and emphasizes the importance of selecting a suitable viewing window for accurate graph interpretation. Through step-by-step examples, he guides on graphing linear, quadratic, cubic, and higher degree polynomial functions, as well as exponential, logarithmic, trigonometric, and rational functions. Soboc provides valuable tips for adjusting viewing windows and utilizing the calculator's features to enhance graphing and problem-solving in mathematics.
Takeaways
- 📚 The video introduces how to graph various types of functions on a TI-84 graphics calculator.
- 🖊️ It demonstrates how to modify line types and colors for the functions if the calculator has color capabilities.
- 🔍 The concept of a 'suitable viewing window' is explained, which is crucial for observing specific features of the graph such as x-intercepts, relative maxima and minima, and intersections of multiple functions.
- 📉 The tutorial covers how to graph linear functions (first-degree polynomials), showing how to input them into the calculator and adjust the viewing window to see the y-intercept and slope.
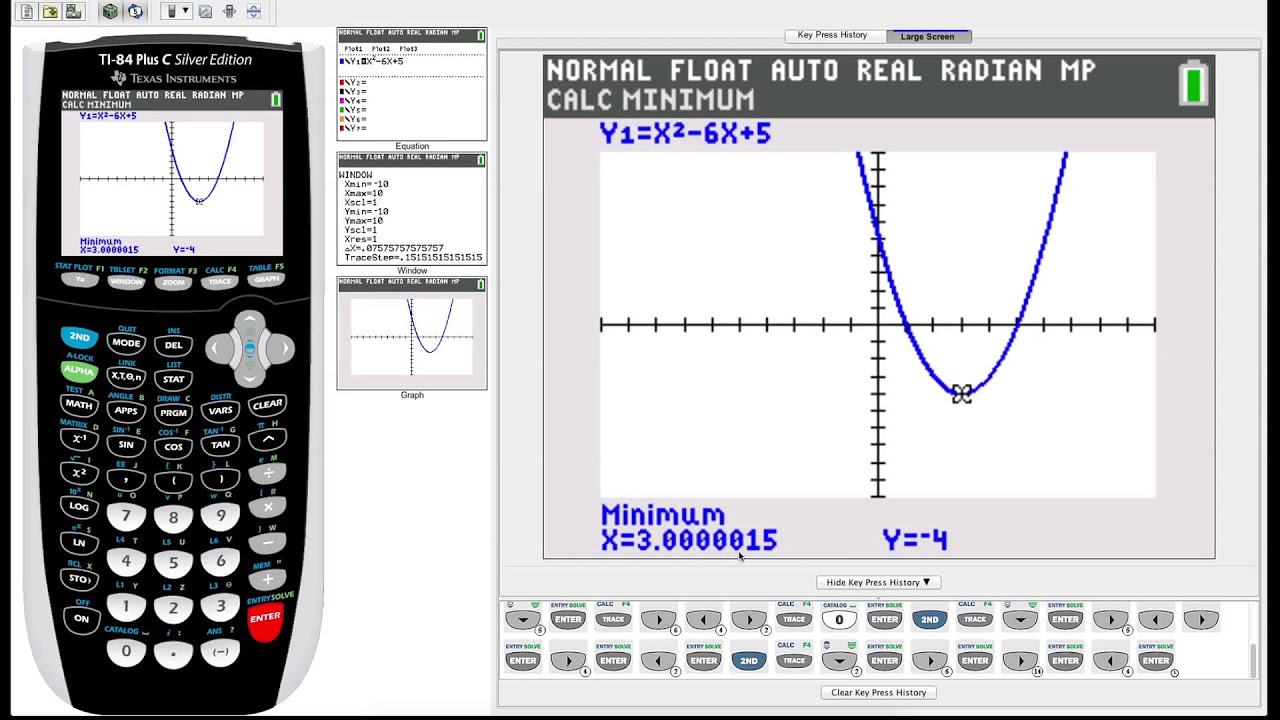
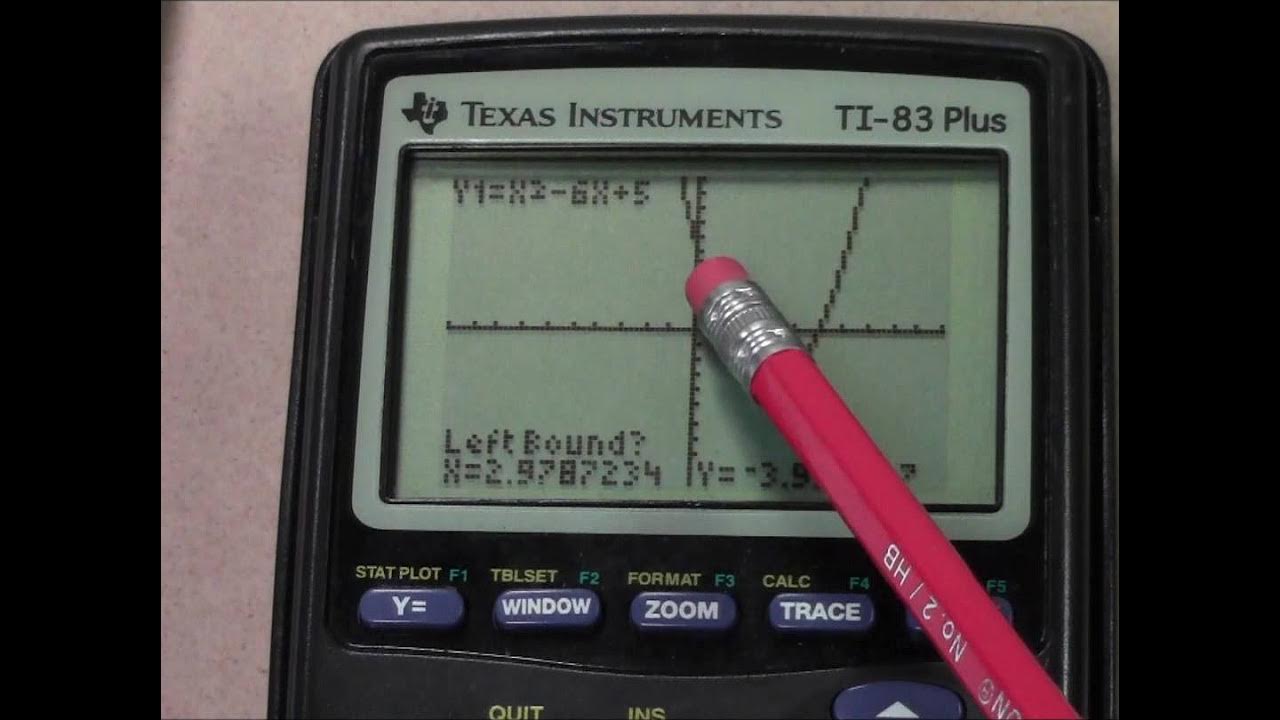
- 📈 The video also explains how to graph quadratic functions (second-degree polynomials), emphasizing the parabolic shape and how to adjust the viewing window to see the entire curve, including the vertex and x-intercepts.
- 📊 For cubic functions (third-degree polynomials), the script discusses the importance of understanding the behavior of the function for extreme values of x and adjusting the viewing window to see all x-intercepts and the relative minimum or maximum.
- 🔢 The process of graphing higher-degree polynomial functions, including quartic and Cordic functions, is outlined, highlighting the need to consider the direction of the function's extreme values based on the leading coefficient.
- 🌐 The video touches on other types of functions such as exponential, logarithmic, trigonometric, and rational functions, providing a brief overview of their characteristics and how they can be graphed on the calculator.
- 🛠️ The importance of using the calculator's tools and utilities after graphing functions is emphasized, suggesting that graphing is just the first step in solving equations and problem-solving using graphs.
- 💻 The video concludes with a reminder that understanding the different types of functions will greatly assist in selecting appropriate viewing windows for accurate graph representation.
Q & A
What is the purpose of the video by Steve Sobek?
-The purpose of the video is to introduce viewers to graphing various types of functions on a TI-84 graphics calculator, including modifying line types and colors, understanding suitable viewing windows, and providing tips for finding them.
What is a suitable viewing window in the context of graphing functions?
-A suitable viewing window is a concept that refers to the specific range of values on the x-axis and y-axis that allows for the clear visualization of important aspects of a graph, such as x-intercepts, relative maxima and minima, or points of intersection for multiple functions.
How do you graph a linear function on a TI-84 calculator?
-To graph a linear function like y = 2x - 4, you would press the 'Y=' button, type in the function under 'Y1', and then press the 'Graph' button. You may need to adjust the viewing window to see the graph clearly.
Why might the initial graph of a function on the calculator not appear as expected?
-The initial graph might not appear as expected because the default viewing window may not be suitable for the function. The graph could be outside the current viewing window, and adjustments to the window settings may be necessary to see the graph correctly.
How can you change the color of the graphed function on a TI-84 calculator?
-To change the color of the graphed function, you would go back to the 'Y=' button, highlight the function you want to change, press 'Enter', and then use the left and right arrow keys to navigate through the color options until you find the desired color.
What is the significance of the 'Zoom Square' feature on the TI-84 calculator?
-The 'Zoom Square' feature adjusts the graph so that each notch is equally spaced on both the x-axis and y-axis, which can be helpful when the calibration on the horizontal axis is different from the vertical axis, making the graph's slope appear inaccurate.
How do you use the table feature on the TI-84 calculator to help find a suitable viewing window?
-The table feature allows you to input specific x-values and see the corresponding y-values. This can help you determine the minimum and maximum values for the y-axis (Ymin and Ymax) and x-axis (Xmin and Xmax) to set a suitable viewing window.
What is a cubic function and how does its graph behave?
-A cubic function is a third-degree polynomial function. Its graph can change directions up to two times, and for extreme values of x, the function will either start from below and finish above or start from above and finish below.
How can you use the box zoom feature on the TI-84 calculator?
-The box zoom feature allows you to designate a specific area of the graph for closer inspection. You set the top left and bottom right corners of a box, and the calculator will zoom into that area, providing a more detailed view of the graph within the box.
What are some considerations for graphing exponential functions on the TI-84 calculator?
-When graphing exponential functions, it's important to remember that they can have horizontal asymptotes. The graph will approach but never reach the x-axis. Also, the viewing window should be adjusted to show the behavior of the function as x approaches very large or very small values.
Outlines
📚 Introduction to Graphing Functions on a TI-84 Calculator
Steve Sobek introduces the video's purpose: teaching viewers how to graph various types of functions on a TI-84 graphics calculator. He explains the process of modifying line types and colors if the calculator has color capabilities. The concept of a 'suitable viewing window' is introduced, which is essential for observing specific features of the graph such as x-intercepts, relative maxima and minima, and intersections of multiple functions. The importance of adjusting the viewing window to focus on these features is emphasized, setting the stage for the examples that will follow.
📈 Graphing Linear Functions and Adjusting Viewing Windows
The video continues with an example of graphing a linear function, Y = 2x - 4, on the TI-84 calculator. Sobek demonstrates how to input the function and graph it using the 'y=' button. He explains the standard window settings and how to adjust them using the 'Zoom' feature for a better view of the graph. The concept of a suitable viewing window is further developed by discussing how to change the window to see specific features like x-intercepts. Additionally, he shows how to change the color of the graph and how to deactivate and activate functions for teaching purposes.
🔍 Adjusting the Viewing Window for Better Function Visualization
Sobek discusses how to adjust the viewing window to better visualize functions, using a second linear function, Y = -x + 21, as an example. He explains that if a function's graph is outside the current viewing window, the window settings need to be manually changed to include the graph. By understanding the function's properties, such as the y-intercept and slope, he guides viewers on how to modify the y-max value to bring the graph into view. This step is crucial for applications where the intersection of two functions is of interest.
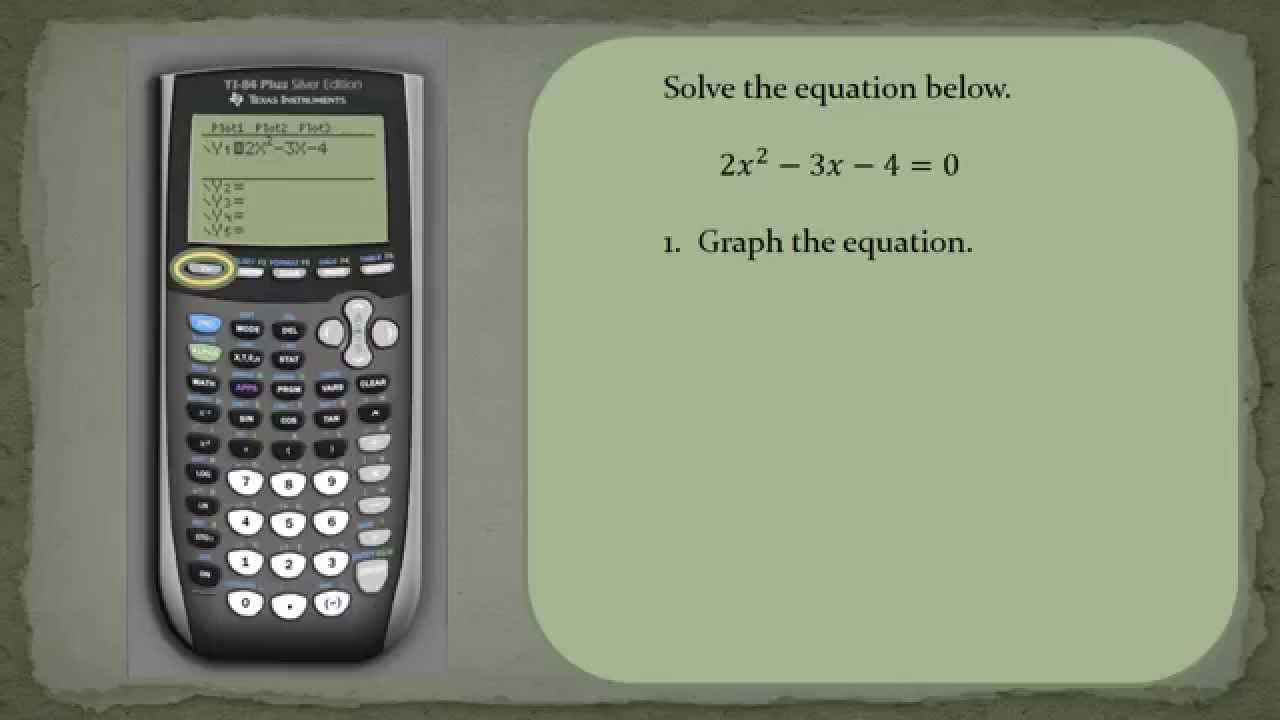
📊 Understanding Quadratic Functions and Their Graphs
The tutorial moves on to graphing a quadratic function, which is a second-degree polynomial. Sobek explains the characteristics of a parabola, including its u-shaped graph, and how to identify whether it opens upwards or downwards by looking at the leading coefficient. He demonstrates how to adjust the y-max value in the viewing window to see the entire parabola, including its vertex and x-intercepts, which is essential for a complete understanding of the function's behavior.
🌐 Graphing and Analyzing Cubic Functions
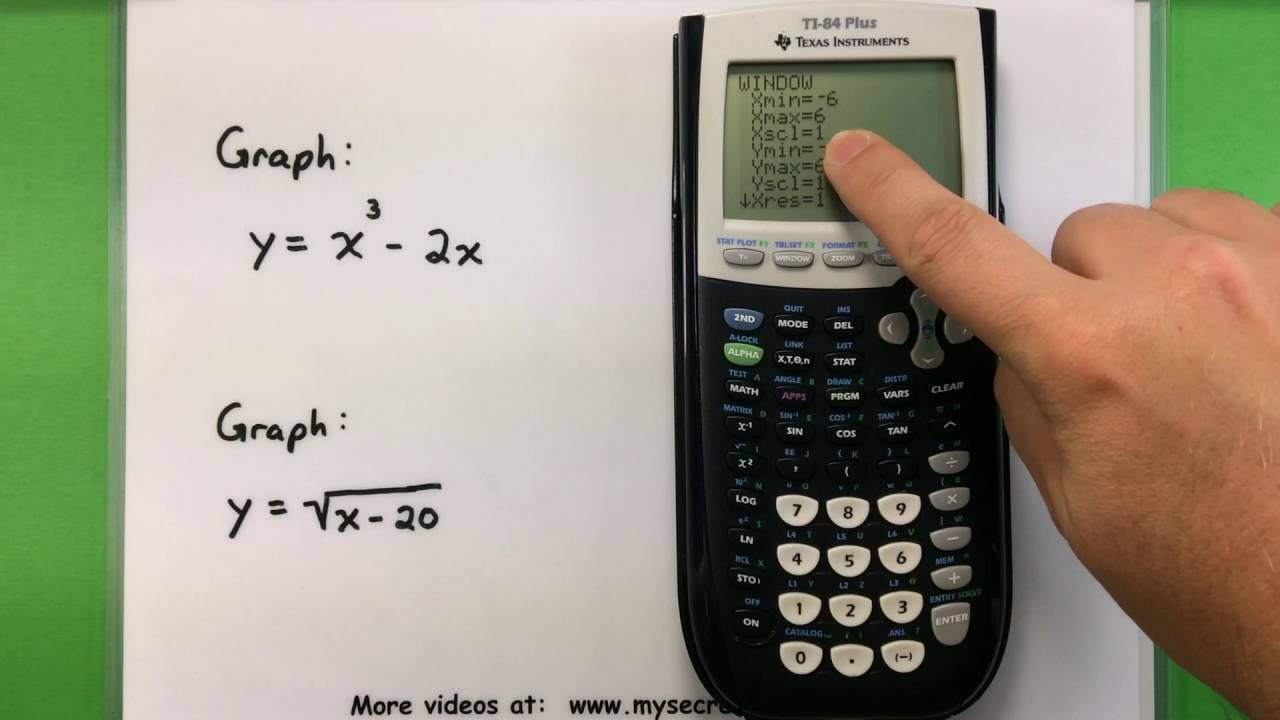
Sobek introduces cubic functions, which are third-degree polynomials, and explains their potential behavior based on the leading coefficient. He shows how to graph a cubic function on the TI-84 calculator and discusses the importance of expanding the viewing window to capture the function's complete graph, including x-intercepts and relative extrema. He also mentions the use of the table feature to help determine the appropriate y-min value for the viewing window.
📉 Adjusting the Viewing Window for Fourth Degree Polynomial Functions
The video covers the graphing of fourth-degree polynomial functions, also known as Cordic functions. Sobek explains the behavior of these functions for extreme values of x and how they differ from cubic functions. He demonstrates the process of adjusting the viewing window, including changing the y-min and x-max values, to ensure the entire function is visible. The summary also includes a brief mention of using the table feature to find the minimum value of the function.
📈 Graphing and Zooming into Specific Regions of the Graph
Sobek discusses the use of the box zoom feature on the TI-84 calculator to focus on specific regions of a graph. He shows how to select a rectangular area to zoom in on, which is particularly useful for examining details of the graph, such as intercepts and asymptotes. The video also summarizes the behavior of odd and even degree polynomial functions, explaining how their graphs behave for extreme values and how to identify the direction of the end behavior based on the leading coefficient.
📊 Graphing Exponential, Logarithmic, and Trigonometric Functions
The video concludes with a brief overview of graphing exponential, logarithmic, and trigonometric functions on the TI-84 calculator. Sobek reminds viewers of the characteristics of these functions, such as the asymptotes for exponential and logarithmic functions and the periodic nature of trigonometric functions. He emphasizes the importance of understanding these functions' behaviors to select suitable viewing windows and provides quick tips for graphing them effectively.
🤓 Final Thoughts on Graphing Rational Functions and the Power of Graphing Calculators
In the final part of the video, Sobek addresses rational functions and the challenges of graphing them, especially on older calculators that may connect points misleadingly. He stresses the importance of understanding asymptotes and the behavior of rational functions to avoid misconceptions. The summary highlights the key points covered in the video, including the use of the TI-84 calculator for graphing various types of functions, modifying graph properties, and the significance of selecting appropriate viewing windows. Sobek also encourages viewers to stay tuned for subsequent videos that will delve into problem-solving using graphing calculators.
Mindmap
Keywords
💡Graphing
💡TI-84 Graphics Calculator
💡Suitable Viewing Window
💡X-Intercepts
💡Relative Maximum and Minimum
💡Linear Function
💡Quadratic Function
💡Cubic Function
💡Polynomial Functions
💡Trigonometric Functions
💡Exponential Functions
💡Logarithmic Functions
💡Rational Functions
Highlights
Introduction to graphing various types of functions on a TI-84 graphics calculator.
Demonstration of modifying line type and changing colors of graphed functions.
Explanation of the concept of a suitable viewing window for graphing functions.
How to graph a linear function and adjust the viewing window to show x-intercepts.
Use of the standard window and zoom features to modify graph appearance.
Changing the color of graphed functions for better visualization.
Techniques for finding suitable viewing windows for different types of functions.
Graphing a second linear function and adjusting the window to show intersection points.
Understanding the characteristics of quadratic functions and their viewing windows.
Graphing cubic functions and identifying suitable windows to show behavior extremes.
Using the table feature on the calculator to find y-minimum values for better window settings.
Graphing higher degree polynomial functions and the importance of understanding their behavior.
Adjusting the y-scale to better visualize steep graphs and avoid cluttered notches.
Introduction to graphing exponential functions and their asymptotic behavior.
Graphing logarithmic functions and their vertical asymptotes.
Trigonometric function graphing and the effect of degree and radian modes on viewing windows.
Graphing rational functions and dealing with vertical and horizontal asymptotes.
Summary of how to graph functions on a TI-84 calculator, including function entry and window adjustments.
Emphasis on the importance of understanding different function types for effective window selection.
Outlook on future videos covering applications of graphing calculators for problem-solving.
Transcripts
Browse More Related Video
TI-84 Plus Graphing Calculator Guide: Graphing functions

How To Graph Functions Using an Online Calculator
How to Solve a Quadratic Equation Using a Ti84
Quadratic Equations using a TI 83 Plus Graphing Calculator
Basic Math - Graphing with a Ti-83 or Ti-84 Calculator
TI-84 Plus Graphing Calculator Guide: Statistics
5.0 / 5 (0 votes)
Thanks for rating: