How To Graph Functions Using an Online Calculator
TLDRThis video introduces an online graphing calculator as a versatile tool for students tackling algebra, pre-calculus, and calculus. The tool is easily accessible via Google search and offers extensive graphing capabilities, including quadratic, cubic, absolute value, and polar functions. It also supports trigonometric, logarithmic, and rational functions, as well as solving systems of equations through graph intersections. Additional features include calculating integrals, evaluating logarithms, and statistical calculations like averages and standard deviations. The video demonstrates the calculator's ability to graph inequalities, perform calculations, and evaluate trigonometric functions in various modes, making it an invaluable resource for a wide range of mathematical disciplines.
Takeaways
- 📚 The video introduces an online graphing calculator for those without physical access to one, useful for algebra, pre-calculus, and calculus.
- 🔍 To access the tool, simply search for 'online graphing calculator' on Google and select the first link, 'The Decimals Graphing Calculator'.
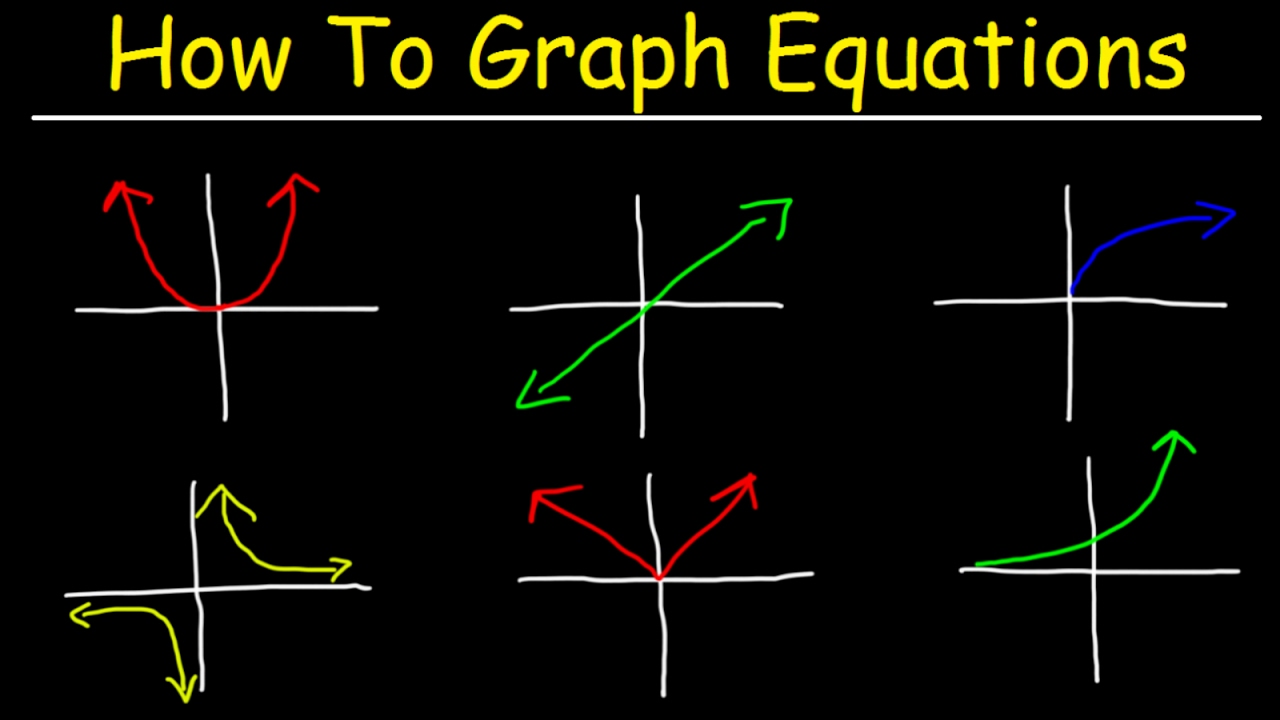
- 📈 The graphing calculator can plot a variety of functions including quadratic, cubic, absolute value, and square root functions.
- 🌐 It also supports polar equations, which is beneficial for graphing complex shapes like limacons and lemniscates.
- 📉 The tool can graph trigonometric, logarithmic, and inverse trigonometric functions, offering a comprehensive solution for different mathematical needs.
- 🤔 The calculator allows for the graphing of multiple functions to solve systems of equations by finding points of intersection.
- 📊 It can assist in calculus by finding x-intercepts and aiding in factoring polynomials by identifying x-intercepts from the graph.
- 📉 Rational functions can be graphed to find horizontal and vertical asymptotes, a crucial feature for understanding their behavior.
- 📏 The tool can also graph vertical and horizontal lines, as well as inequalities, which is useful for visualizing and solving complex problems.
- 📊 Beyond graphing, the calculator performs various mathematical calculations, including evaluating logs and integrals.
- 📈 It provides statistical functions such as calculating averages, standard deviations, combinations, permutations, and factorials.
- 📚 The video concludes by demonstrating how to evaluate trigonometric functions at different angles, both in degree and radian modes.
Q & A
What is the purpose of the online graphing calculator mentioned in the video?
-The online graphing calculator is intended to assist students who may not have a physical graphing calculator, particularly for subjects like algebra 2, pre-calculus, and calculus.
How can one access the online graphing calculator discussed in the video?
-To access the online graphing calculator, one should go to Google and type in 'online graphing calculator'. The first link that appears, 'the decimals graphing calculator', should be selected.
What types of functions can be graphed using the online calculator?
-The online calculator can graph a variety of functions including quadratic, cubic, absolute value functions, square root functions, polar equations, trigonometric equations, logarithmic equations, and more.
Can the calculator graph polar equations such as limacons and lemna skates?
-Yes, the calculator is very useful for graphing polar equations like limacons and lemna skates.
How does the online calculator help in solving systems of equations?
-The calculator helps in solving systems of equations by graphing. Users can input multiple equations and find the point of intersection, which represents the solution to the system.
What is an example of how the calculator can be used to find x-intercepts of a graph?
-For example, if you set the equation x squared minus 4x equal to zero, the calculator can help you find the x-intercepts, which in this case are 0 and 4.
How can the calculator assist in factoring equations?
-By graphing an equation, the calculator can show the x-intercepts, which can then be used to determine the factors of the equation. For instance, if the intercepts are -2 and -3, the factored form would be (x + 2)(x + 3).
What are some additional features of the online calculator beyond graphing?
-The calculator also allows for calculations, such as basic arithmetic, converting fractions to decimals, evaluating logarithms, finding integral values, and even statistical calculations like averages and standard deviations.
Can the calculator graph rational functions and help identify asymptotes?
-Yes, the calculator can graph rational functions and assist in identifying both vertical and horizontal asymptotes.
What types of lines and inequalities can be graphed using the calculator?
-The calculator can graph vertical lines, horizontal lines, and inequalities, allowing users to shade regions that satisfy certain conditions.
How does the calculator handle exponential functions and natural logarithms?
-The calculator can graph exponential functions, such as 2 raised to the power of x, and natural logarithms, like ln(x), providing a visual representation of these mathematical concepts.
What statistical features are available in the calculator for students taking statistics?
-The calculator offers features such as finding the average (arithmetic mean) of a set of numbers, calculating standard deviation, and performing combinatorial calculations like combinations and permutations.
Outlines
📚 Introduction to Online Graphing Calculator
The video introduces an online graphing calculator as a useful tool for students who may not have access to a physical graphing calculator. It guides viewers on how to find and use the tool by searching for 'online graphing calculator' on Google. The tool is highlighted for its ability to graph a variety of functions, including quadratic, cubic, absolute value, and polar equations. The video also demonstrates how to graph trigonometric, logarithmic, and inverse functions, showcasing the calculator's versatility in solving algebraic and calculus problems, as well as its capability to graph multiple functions simultaneously to solve systems of equations.
🔍 Advanced Graphing Techniques and Calculations
This paragraph delves into more advanced uses of the online graphing calculator, such as solving equations by graphing, factoring, and finding x-intercepts. It explains how to identify solutions to equations like x^2 - 4x = 0 by setting them to zero and finding the intercepts. The video also covers graphing rational functions to find horizontal and vertical asymptotes, as well as graphing vertical and horizontal lines and inequalities. Additional features include the calculator's ability to perform basic arithmetic, convert fractions to decimals, and evaluate logarithms, making it a comprehensive tool for various mathematical tasks.
📈 Calculus, Statistics, and More with the Graphing Calculator
The final paragraph of the script highlights the calculator's capabilities in calculus and statistics. It demonstrates how to evaluate integrals, such as ∫x^2 from 1 to 2, and how to find averages and standard deviations of a set of numbers. The tool also supports statistical functions like combinations, permutations, and factorials. Moreover, it can evaluate expressions in sigma notation and trigonometric functions at various angles, both in degree and radian modes. The video concludes by emphasizing the wide range of mathematical functions and calculations that can be performed using the online graphing calculator, making it a valuable resource for students across different math courses.
Mindmap
Keywords
💡Online Graphing Calculator
💡Quadratic Functions
💡Cubic Functions
💡Absolute Value Functions
💡Polar Equations
💡Trigonometric Equations
💡Logarithmic Equations
💡System of Equations
💡Factoring
💡Rational Functions
💡Integral
Highlights
Introduction to an online graphing calculator as a useful tool for students without physical graphing calculators.
Demonstration of how to access the graphing calculator by searching 'online graphing calculator' on Google.
Capability to graph quadratic functions and identify x-intercepts.
Ability to graph cubic functions and absolute value functions.
Graphing of polar equations, such as r=2cos(θ), for complex shapes like limacons and lemniscates.
Graphing of trigonometric equations including sine and cosine functions.
Inclusion of secant, cosecant, and tangent functions in the graphing capabilities.
Graphing logarithmic equations with different bases.
Utility in solving systems of equations by graphing their points of intersection.
Technique to find x-intercepts and solve equations by graphing.
Method to factor equations by graphing and identifying x-intercepts.
Graphing rational functions and identifying vertical and horizontal asymptotes.
Graphing of vertical and horizontal lines, and inequalities.
Graphing exponential functions and finding horizontal asymptotes.
Performing calculations and converting fractions to decimals.
Evaluating logarithms and integrals using the calculator.
Finding averages and standard deviations for statistics.
Calculating combinations, permutations, and factorials.
Evaluating expressions in sigma notation for arithmetic sequences.
Evaluating trigonometric functions at different angles in both degree and radian modes.
Conclusion highlighting the wide range of functionalities and benefits of the graphing calculator for various math courses.
Transcripts


5.0 / 5 (0 votes)
Thanks for rating: