Everything is a linear model (nearly)
TLDRIn this educational video, Dr. J Cordy delves into the concept that all statistical tests, including t-tests, ANOVAs, ANCOVAs, and even quadratic models, are fundamentally linear models. He argues that the choice of test is less important than selecting a model that significantly explains variation. Dr. Cordy uses Karl Popper's philosophy of science to emphasize the importance of falsifiable predictions in statistical models. He demonstrates how means and linear regressions serve as predictive tools, showing that they yield the same predictions, degrees of freedom, and p-values as t-tests and ANOVAs. The video aims to simplify statistical analysis by illustrating that all models can be treated as linear for prediction purposes.
Takeaways
- 📚 Dr. J Cordy emphasizes that all statistical tests are fundamentally linear models, including t-tests, ANOVAs, ANCOVAs, and even quadratic models.
- 🔍 The video aims to demonstrate the linearity of these models to clarify that the choice of statistical test should be based on the model's appropriateness rather than the type of data.
- 👨🏫 Dr. Cordy references Karl Popper's philosophy of science, highlighting that a good theory should be falsifiable and make specific predictions about the world.
- 🧐 The script explains that statistical models are mathematical processes designed to describe and predict population characteristics based on sample data.
- 📈 The mean is presented as a statistical model that predicts the expected value of a single observation or a group of observations from the population.
- 📊 Linear regression is equated to the simple equation of a line (y = mx + c), with 'm' and 'c' represented as beta coefficients in statistical terms.
- 🔢 Dr. Cordy illustrates how to use a linear regression formula to make predictions about future samples, using an example with 'knowledge of immunology' and 'coolness'.
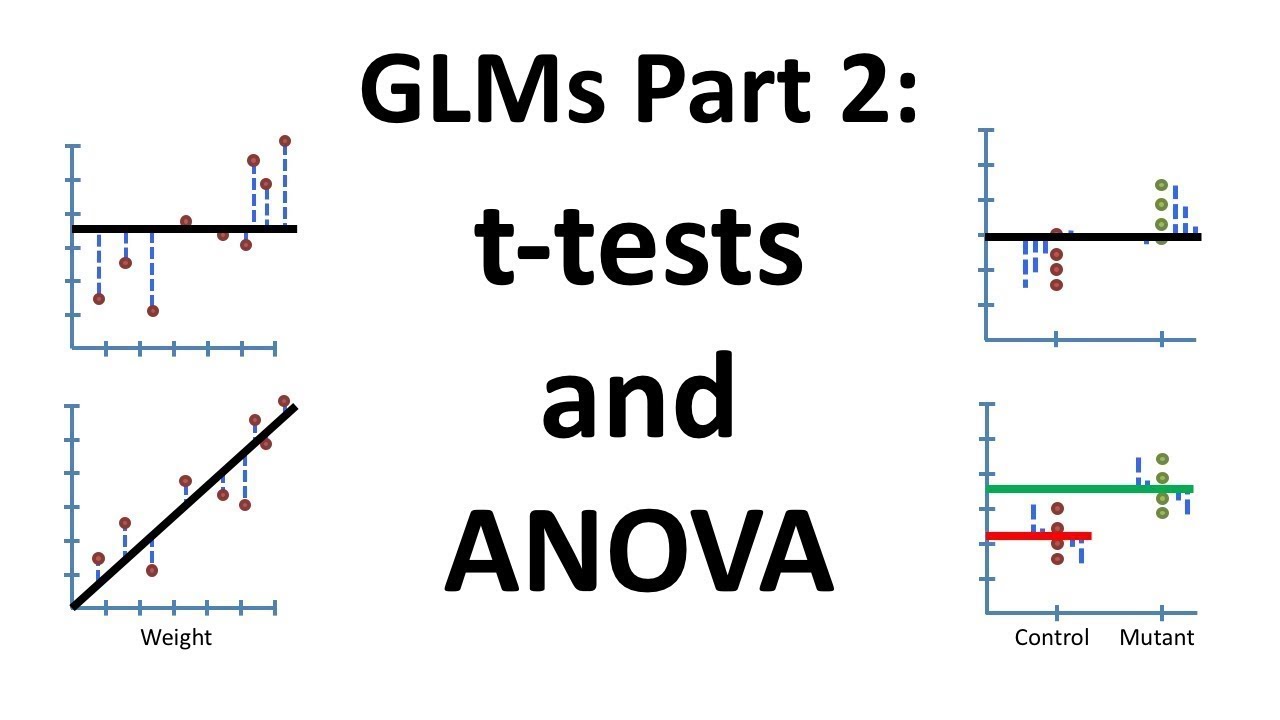
- 🌟 The video provides a step-by-step comparison of running a t-test versus a linear regression on the same data, showing they yield identical results.
- 📝 The script clarifies that the degrees of freedom and p-values from both t-tests and linear regressions are the same because they are essentially the same model.
- 🤔 Dr. Cordy addresses potential confusion about applying linear models to more than one group, suggesting that it involves running multiple linear regressions and comparing slopes.
- 🚀 The video concludes with a teaser for the next video where Dr. Cordy will use Jamovi software to demonstrate the concepts with real statistical analysis.
Q & A
What is the main argument presented by Dr. J Cordy in the video?
-Dr. J Cordy argues that all statistical tests are essentially linear models, including t-tests, ANOVAs, ANCOVAs, and even quadratic models, which are often considered non-linear.
Why does Dr. Cordy believe it's important to understand that statistical tests are linear models?
-Understanding this concept is crucial because it helps people to focus on choosing an appropriate statistical model to explain significant variation rather than getting hung up on which specific test to use.
According to Dr. Cordy, what is the fundamental purpose of a statistical model?
-The fundamental purpose of a statistical model is to make predictions about future samples based on the population from which the current sample was drawn.
What does Dr. Cordy suggest is the basis for a good biological theory according to Karl Popper?
-A good biological theory, according to Karl Popper, should make predictions that are falsifiable, meaning if the predictions do not come true, the theory is falsified.
How does Dr. Cordy relate the concept of a mean to a statistical model?
-Dr. Cordy explains that a mean is a statistical model that predicts the expected value or the average outcome if you were to sample a single or multiple entities from a population.
What is the formula for a line that Dr. Cordy refers to in the video?
-The formula for a line that Dr. Cordy refers to is 'y = mx + c', where 'y' is the dependent variable, 'm' is the slope, 'x' is the independent variable, and 'c' is the y-intercept.
How does Dr. Cordy demonstrate that a t-test and ANOVA are linear models?
-Dr. Cordy demonstrates this by showing that both t-tests and ANOVAs can be represented as linear models with the same predicted values, degrees of freedom, and p-values.
What is the significance of the degrees of freedom in the context of the video?
-Degrees of freedom represent the number of independent pieces of information that are available to estimate the population parameters. In the video, Dr. Cordy explains how degrees of freedom are calculated in the context of t-tests and linear regression.
How does Dr. Cordy explain the process of running a linear regression on the provided example data?
-Dr. Cordy explains that by assigning numerical values to different groups (e.g., 0 for placebo and 1 for pollen) and running a linear regression, the same predicted values and statistical outcomes (such as p-values) can be obtained as with a t-test.
What is the practical implication of Dr. Cordy's argument for those conducting statistical analyses?
-The practical implication is that instead of focusing on which specific statistical test to use, one should concentrate on applying a statistical model that is appropriate for the data and evaluating whether it explains a significant amount of variation.
What does Dr. Cordy suggest for viewers who want to follow along with the statistical examples in the next video?
-Dr. Cordy suggests that viewers should download Jamovi, a statistical software, so they can follow along with the video and run through the statistical examples themselves.
Outlines
📚 Understanding Linear Models in Statistics
Dr. J Cordy introduces the concept that all statistical tests are essentially linear models. He explains that tests like t-tests, ANOVAs, and even non-linear models such as quadratic models can be considered linear. The focus should be on selecting an appropriate model to explain significant variation rather than the type of test. He emphasizes the importance of understanding the statistical process and references Karl Popper's philosophy on falsifiable theories that make predictions. Dr. Cordy uses the example of a mean as a statistical model predicting the expected value of a population based on a sample.
🧐 Demonstrating Linearity in Statistical Models
The video script continues with Dr. Cordy's demonstration that linear models can replicate the predictions made by t-tests and ANOVAs. He uses the linear regression formula (y = mx + c) and its statistical counterpart (y = beta0 + beta1*x) to show how both can be used to make predictions. An example is given where 'knowledge of immunology' is used to predict 'coolness' on a scale, illustrating how a linear model can provide predicted values for future samples.
📉 Comparing Linear Regression with t-Test Results
Dr. Cordy compares the results of a t-test with those of a linear regression to prove their equivalence. He uses a dataset with 'snot production' as the dependent variable and 'placebo' vs 'pollen' as the independent variable. By assigning numerical values to these categories, he shows that the predicted values, degrees of freedom, and p-values from both methods are identical. This comparison illustrates that linear models encompass a wide range of statistical tests and can be used to analyze and predict outcomes in various scenarios.
📚 Expanding on Linear Models for Multiple Groups
The final paragraph discusses the application of linear models to more complex scenarios involving multiple groups. Dr. Cordy explains that while it may seem challenging to apply a linear model to more than one group, it can be done effectively by running multiple linear regressions and comparing slopes. He assures that the numerical and statistical outcomes will be consistent, regardless of the complexity of the model. The script concludes with an invitation to join a future video where actual statistical analysis using Jamovi software will be demonstrated.
Mindmap
Keywords
💡Statistical tests
💡Linear models
💡Degrees of freedom
💡P-value
💡Karl Popper
💡Falsifiable
💡Mean
💡Regression
💡ANOVA
💡Quadratic models
💡Predictive value
Highlights
Dr. J Cordy argues that all statistical tests are essentially linear models.
The video demonstrates the linear nature of various statistical tests including t-tests, ANOVAs, and multiple regressions.
Quadratic models are also shown to be linear models in disguise.
The focus should be on choosing an appropriate statistical model rather than the type of test.
Karl Popper's concept of falsifiability in theories is linked to statistical models making predictions.
Statistical models aim to describe the population from which a sample is drawn to make future predictions.
The mean is presented as a statistical model predicting the expected value of a population.
T-tests and ANOVAs are linear models that make the same predictions as a linear regression.
The formula for a line, y = mx + c, is repurposed in statistical terms as y = beta0 + beta1 * x.
An example using 'knowledge of immunology' against 'coolness' illustrates the prediction process.
Predicted values from a linear model match those from a t-test or ANOVA for the same data set.
Degrees of freedom are calculated and shown to be the same for both linear models and t-tests.
P-values from linear models and t-tests are identical, proving they are the same underlying process.
The process of converting data for a t-test into a linear model is demonstrated with an example.
Linear regression is shown to handle categorical data by assigning numerical values to groups.
The video promises a practical demonstration using Jamovi software in the next video.
Transcripts


5.0 / 5 (0 votes)
Thanks for rating: