Chi-square distribution introduction | Probability and Statistics | Khan Academy
TLDRThis video introduces the chi-square distribution, a set of distributions used to test the fit of theoretical models to observed data. It explains that the chi-square is derived from the sum of squared standard normal random variables, with the distribution's shape depending on the number of variables squared, known as degrees of freedom. The video also demonstrates the use of a chi-square table to find the probability of a variable exceeding a certain value, highlighting its importance in measuring error and making statistical inferences.
Takeaways
- 📊 The chi-square distribution, also known as chi-squared distribution, is a probability distribution related to the standard normal distribution.
- 🎲 It is derived from squaring independent standard normally distributed random variables and summing them up.
- 🔢 The distribution is characterized by its degrees of freedom, which depends on the number of variables being squared and summed.
- 📈 The shape of the chi-square distribution changes with the degrees of freedom, becoming more symmetric and shifted to the right as the degrees of freedom increase.
- 🚫 A chi-square distribution cannot have negative values since it involves squaring of values.
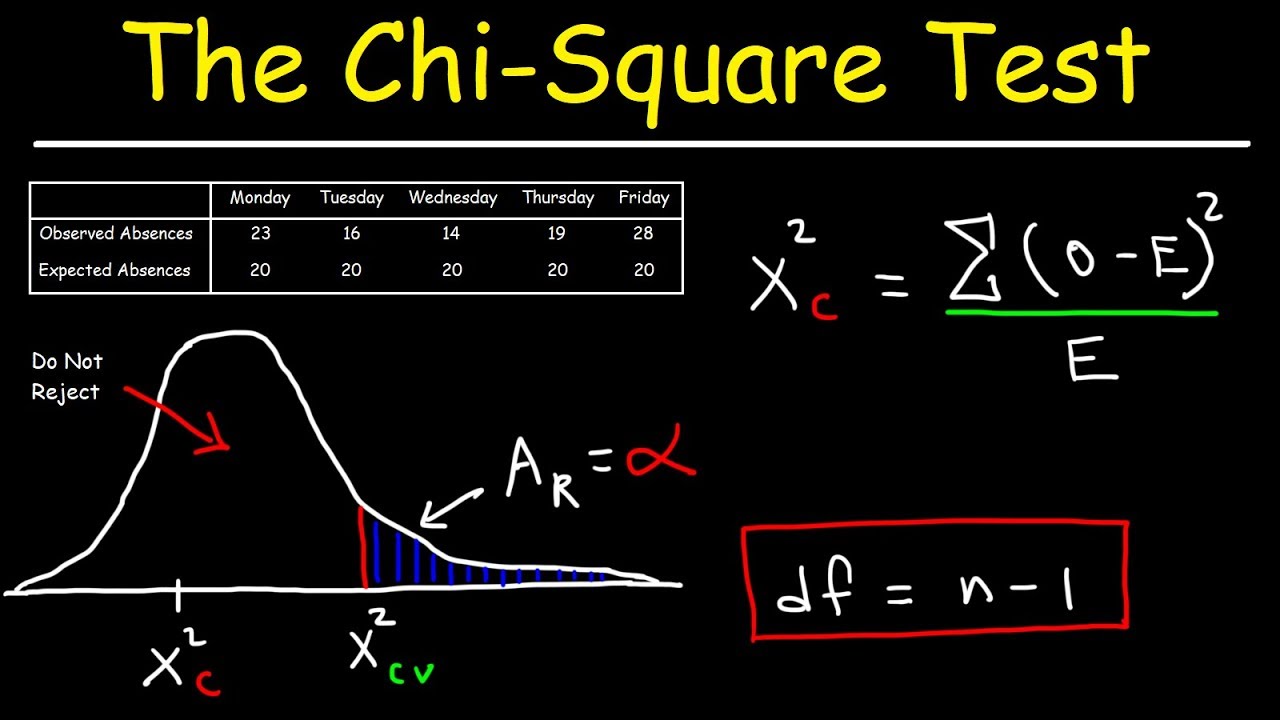
- 📊 The chi-square distribution is used to test how well theoretical distributions explain observed ones or to assess the goodness of fit of observed results to theoretical distributions.
- 📏 The probability density function (PDF) of a chi-square distribution spikes close to 0, indicating a high likelihood of obtaining small values.
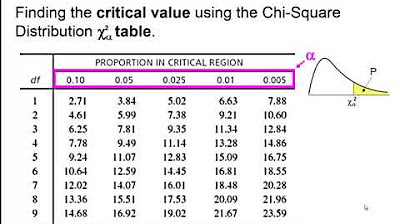
- 🔍 The chi-square table provides p-values, which represent the probability of obtaining a chi-square value larger than a given value.
- 📝 To find a p-value in a chi-square table, one looks up the corresponding row for the degrees of freedom and finds the percentage associated with the specific chi-square value.
- 🌟 As the degrees of freedom increase, the peak of the distribution shifts towards larger values, and the distribution approaches a normal distribution.
- 🔗 The chi-square distribution is particularly useful in statistical applications for measuring error from expected values and for hypothesis testing in inferential statistics.
Q & A
What is the chi-square distribution?
-The chi-square distribution, also known as the chi-squared distribution, is a probability distribution that describes the sum of the squares of independent standard normally distributed random variables. It is commonly used in statistical analysis for hypothesis testing and goodness-of-fit tests.
How is the chi-square distribution related to standard normal distribution?
-The chi-square distribution is derived from the standard normal distribution by squaring the values of independent standard normally distributed random variables and summing them up. Each of these random variables has a mean of 0 and a standard deviation of 1.
What does it mean for a chi-square distributed random variable to have 'degrees of freedom'?
-The degrees of freedom for a chi-square distributed random variable refer to the number of independent standard normal random variables being squared and summed. The more variables you have, the higher the degrees of freedom, which influences the shape of the chi-square distribution.
How does the shape of the chi-square distribution change with the number of degrees of freedom?
-As the number of degrees of freedom increases, the peak of the chi-square distribution shifts to the right, and the distribution becomes more symmetric. With fewer degrees of freedom, the distribution is more heavily weighted towards smaller numbers.
Why is the chi-square distribution always positive?
-The chi-square distribution is always positive because it involves the squaring of values from standard normal distributions. Since squaring any real number results in a non-negative value, the sum of squares will always be positive.
What is the practical application of the chi-square distribution in statistics?
-The chi-square distribution is used to measure the difference between observed and expected frequencies in a dataset. It helps in determining how well a theoretical model fits the observed data, often used in hypothesis testing and goodness-of-fit tests.
How do you read a chi-square distribution table?
-A chi-square distribution table provides the chi-square values for different degrees of freedom and their corresponding p-values. To use the table, you find the row for the desired degrees of freedom and locate the p-value for a specific chi-square value. The p-value represents the probability of observing a chi-square value that is as large as, or larger than, the given value.
What is the significance of the p-value in the context of the chi-square distribution?
-The p-value in the context of the chi-square distribution indicates the probability of obtaining a test statistic as extreme as, or more extreme than, the observed value under the null hypothesis. It is used to make decisions in hypothesis testing, with a smaller p-value indicating stronger evidence against the null hypothesis.
How does the chi-square distribution relate to the concept of error in statistical analysis?
-The chi-square distribution is used to quantify the error between observed and expected values in a dataset. By comparing the observed frequencies to the frequencies expected under a certain theoretical model, the chi-square statistic can be calculated. This statistic then provides a measure of the discrepancy or error between the two.
Can you provide an example of a chi-square distribution with 1 degree of freedom?
-An example of a chi-square distribution with 1 degree of freedom (denoted as χ²₁) would involve squaring a single standard normal random variable and summing it up. The resulting distribution would have a high probability of getting values close to 0 and a rapidly decreasing probability for larger values, as it is heavily weighted towards smaller numbers.
What happens to the chi-square distribution as the degrees of freedom increase indefinitely?
-As the degrees of freedom increase indefinitely, the chi-square distribution approaches the shape of a normal distribution. The peak becomes less pronounced and the distribution becomes more symmetric, with the mean and median converging to the value of (degrees of freedom - 1).
Outlines
📊 Introduction to Chi-Square Distribution
This paragraph introduces the concept of the chi-square distribution, also known as chi-squared distribution. It explains that the distribution is related to independent, standard, normally distributed random variables. The video aims to use the chi-square distribution in upcoming videos to test the fit between theoretical and observed distributions. The explanation begins with a review of normally distributed random variables, such as having a mean of 0 and a variance of 1, and then introduces the chi-square distribution by squaring these variables. The paragraph also touches on the idea that the chi-square distribution is a family of distributions that depends on the number of variables squared. The example given involves squaring a single standard normal variable, which corresponds to a chi-square distribution with 1 degree of freedom.
📈 Characteristics and Probability Density Functions of Chi-Square Distribution
This paragraph delves into the characteristics of the chi-square distribution, highlighting how the distribution's shape changes with the degrees of freedom. It explains that with only 1 degree of freedom, the distribution is heavily weighted towards 0, as the likelihood of sampling a value close to 0 from a standard normal distribution is high, and squaring this value makes it even smaller. As the degrees of freedom increase, the distribution shifts to the right and becomes more symmetric. The paragraph also discusses the practical impossibility of obtaining negative values in the chi-square distribution due to the squaring of positive values. The explanation includes a visual reference to the probability density functions of different chi-square distributions, illustrating how the lump of the distribution moves to the right with more degrees of freedom. Additionally, the paragraph touches on the application of the chi-square distribution in measuring error from expected values and its use in hypothesis testing, which will be further explored in subsequent videos.
🔍 Reading Chi-Square Distribution Table
The final paragraph of the script focuses on how to read a chi-square distribution table, which is essential for determining probabilities associated with specific values in the distribution. The video provides an example of finding the probability of a chi-square distributed variable with 2 degrees of freedom being greater than a certain value (2.41 in this case). It explains that the chi-square table provides p-values, which represent the probability of obtaining a value as large or larger than the one in question. The paragraph concludes with a brief mention of the upcoming video content, where the chi-square distribution will be applied to make inferences and test hypotheses.
Mindmap
Keywords
💡Chi-square distribution
💡Random variables
💡Standard normal distribution
💡Degrees of freedom
💡Expected value
💡Variance
💡Probability density function (PDF)
💡Chi-square table
💡Hypothesis testing
💡Error measurement
Highlights
The introduction of the chi-square distribution, also known as the chi-squared distribution, and its significance in statistical analysis.
The explanation that chi-square distribution is used to test how well theoretical distributions explain observed ones, and the fit of observed results to theoretical distributions.
The description of normally distributed random variables and their properties, such as having a mean of 0 and a variance of 1.
The definition of a new random variable Q, which is the square of a standard normal distribution random variable X.
The concept of degrees of freedom in the context of chi-square distribution, starting with 1 degree of freedom for a single variable squared.
The visualization of chi-square distributions and how they change with varying degrees of freedom.
The explanation that chi-square distribution is a set of distributions depending on the number of sums of squared variables.
The example of calculating a chi-square distributed random variable Q2 with 2 degrees of freedom by squaring and summing two independent standard normally distributed variables.
The characteristic of chi-square distributions that they are always positive since they involve squaring and summing of squares.
The unique feature of chi-square distributions that they cannot have values below 0, unlike the original normally distributed variables.
The application of chi-square distributions in measuring error from expected values and determining probabilities under certain parameters.
The demonstration of how to read a chi-square distribution table and its use in finding probabilities for specific values.
The explanation of p-values in the context of chi-square distribution and their use in statistical testing.
The overview of how chi-square distributions become more symmetric and the peak moves to the right with an increase in degrees of freedom.
The anticipation of future videos where chi-square distributions will be used to make inferences and test hypotheses.
Transcripts
Browse More Related Video


5.0 / 5 (0 votes)
Thanks for rating: