Mathematical Statistics, Lecture 1
TLDRThe video script is a lecture for a mathematical statistics course, where the professor expresses enthusiasm for teaching the subject. The lecture clarifies the difference between probability and statistics, noting that probability is about future outcomes, while statistics involves analyzing past data to infer properties about a population. The course focuses on the theoretical aspects of probability necessary for conducting statistical analyses. The professor introduces the concept of random variables, discrete and continuous distributions, and the importance of indicator functions in probability density functions (pdfs). The lecture also covers cumulative distribution functions (cdfs) and the concept of expected value. The professor emphasizes the practical applications of these concepts, such as in creating tests and estimating parameters for non-normal distributions. The lecture concludes with a review of course materials, including a textbook and a distributions table, which are essential for understanding the course content.
Takeaways
- 🎓 The professor introduces the course as their all-time favorite, emphasizing its theoretical nature and focus on probability as it relates to statistics.
- 📚 The course will cover creating rules for statistical tests and confidence intervals, which are typically taught in introductory statistics courses.
- 🔍 The distinction between probability and statistics is clarified: probability is about future events, while statistics involves analyzing past data to make inferences.
- 📈 The course will begin with parameter estimation, using the sample mean as a common sense estimator for the population mean.
- 📒 The professor has written their own textbook, which will be used as the primary course material and is recommended to be downloaded for easy access.
- 📊 Emphasis is placed on the importance of understanding distributions, with a suggestion to print and laminate the distributions table for frequent reference.
- ✅ The grading structure is outlined, with homework accounting for 30%, two midterms each for 25%, and a final exam for 20% of the grade.
- 🕒 Midterm exams are scheduled for Thursday evenings, with a generous time allowance to ensure students have ample time to complete them.
- 📅 The final exam date is set by the university and the course is a preparatory class for a preliminary exam in probability and statistics.
- 📝 Homework assignments will be released on Wednesdays and are expected to be submitted by the following Wednesday, with a lenient policy on late submissions unless necessary.
- ❗ The professor stresses the importance of keeping up with the course material to avoid falling behind, and encourages students to review prerequisite material.
Q & A
What is the main focus of the course being taught in the transcript?
-The main focus of the course is mathematical statistics, which is a theoretical course centered around probability needed to perform statistical analysis. It involves creating rules for statistical tests and building confidence intervals.
Why does the instructor claim that probability is not simply reverse engineering statistics?
-The instructor claims that probability is not reverse engineering statistics because while you can study probability without ever delving into statistics, the reverse is not true. Statistics often relies on understanding probability, but probability does not depend on statistics.
What are the two most important parts of the course according to the instructor?
-The two most important parts of the course are the 'course notes' which will serve as the textbook, and the 'distributions' button which contains a table of various distributions that are crucial for the course.
What is the grading structure for the course?
-The grading structure consists of homework (30%), two midterms (each contributing 25%), and a final exam (20%).
How does the instructor plan to handle homework submissions?
-The instructor plans to assign homework on Wednesdays with a deadline the following Wednesday. Students can submit their homework as a PDF, either handwritten and scanned or typed up, and if necessary, as JPEGs.
What is the difference between a Bernoulli random variable and an exponential distribution?
-A Bernoulli random variable is a discrete random variable that takes on two possible outcomes, often used to represent a single trial with two possible outcomes like heads or tails in a coin flip. An exponential distribution, on the other hand, is a continuous distribution that models the time between events in a process where events occur continuously and independently at a constant average rate.
What is the role of the indicator function in probability distributions?
-The indicator function is used to specify the range of values that a random variable can take. It equals 1 when the condition it represents is met (e.g., a value being within a certain interval) and 0 otherwise. This function simplifies the notation for probability density functions (pdfs) and cumulative distribution functions (cdfs).
What does the instructor mean by 'common sense estimator' or 'natural estimator'?
-The 'common sense estimator' or 'natural estimator' refers to an intuitive or obvious choice for estimating a parameter. For example, using the sample mean to estimate the population mean is a common sense estimator because it's the average of the observed data.
How does the instructor intend to handle additional office hours?
-The instructor has set up specific office hours with a designated Zoom number, but they also express willingness to find time to meet students outside of these designated hours if necessary.
What is the significance of the course notes being in progress?
-The course notes being in progress indicates that the instructor has been continuously updating and refining the textbook material for the course. It currently stands at about 258 pages and is intended to be a comprehensive resource for the course content.
What is the purpose of the supplementary material that will be handed out?
-The supplementary material will be used to cover additional topics that are not included in the main course notes. These materials will be distributed when the course reaches those specific topics to provide deeper insights or cover areas in more detail.
What is the relationship between the course 5530 and course 5520 as mentioned in the transcript?
-Course 5530 is a more in-depth version of course 5520, both of which are focused on mathematical statistics. Course 5530 goes faster, covers more proof and theorem, and includes some extra topics, distinguishing it from the more general 5520 course.
Outlines
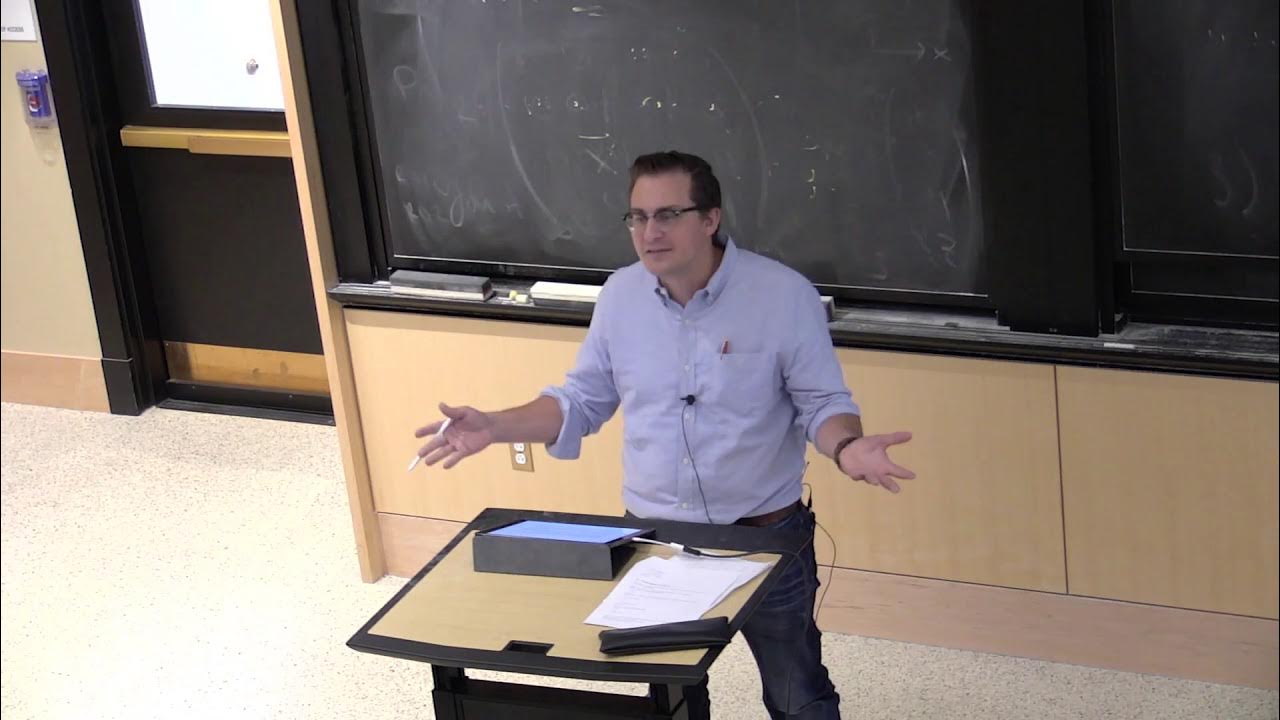
😀 Introduction to Mathematical Statistics
The instructor begins by expressing enthusiasm for teaching mathematical statistics, which focuses on the theoretical aspect of probability essential for understanding statistics. The course will delve into creating custom statistical tests, exploring the origins of tests like the t-test, and handling situations where data does not meet standard assumptions. It emphasizes the difference between probability, which is about future events, and statistics, which involves analyzing past data to infer properties of a population. The course materials include the instructor's textbook and a distributions table, which are crucial for the class.
📚 Course Structure and Materials
The course structure is outlined, highlighting the importance of the course notes and the distributions button on the course page. The instructor provides office hours and offers flexibility for students who may need additional time. The grading is based on homework, midterms, and a final exam. The course is a more in-depth version of another course, 5520, and is designed to be faster, deeper, and include more proofs and theorems. Homework assignments are due every Wednesday, and the first homework is already posted as a prerequisite review.
📈 Random Variables and Distributions
The lecture moves on to discuss random variables, which are mappings from the outcomes of a probabilistic experiment to real numbers. The concept of a Bernoulli random variable is introduced, characterized by a probability mass function (pmf), with examples given for both discrete and continuous random variables. The instructor emphasizes the importance of understanding the difference between discrete and continuous distributions and the role of probability density functions (pdf) in describing these distributions.
🎓 Review of Probability Concepts
The instructor reviews the basics of probability, including random variables, Bernoulli distributions, and the concept of a probability density function (pdf). The difference between discrete and continuous random variables is clarified, with the pdf for a Bernoulli random variable and an exponential distribution provided as examples. The lecture also touches on the importance of understanding the underlying principles of probability before moving on to more advanced topics.
📉 Continuous Random Variables and Exponential Distribution
The focus shifts to continuous random variables, with the exponential distribution as a key example. The instructor explains the probability density function (pdf) of the exponential distribution and how it is used in scenarios such as waiting times in Markov processes. The concept of a rate parameter in the context of exponential distribution is introduced, and the importance of the parameter being greater than zero is emphasized.
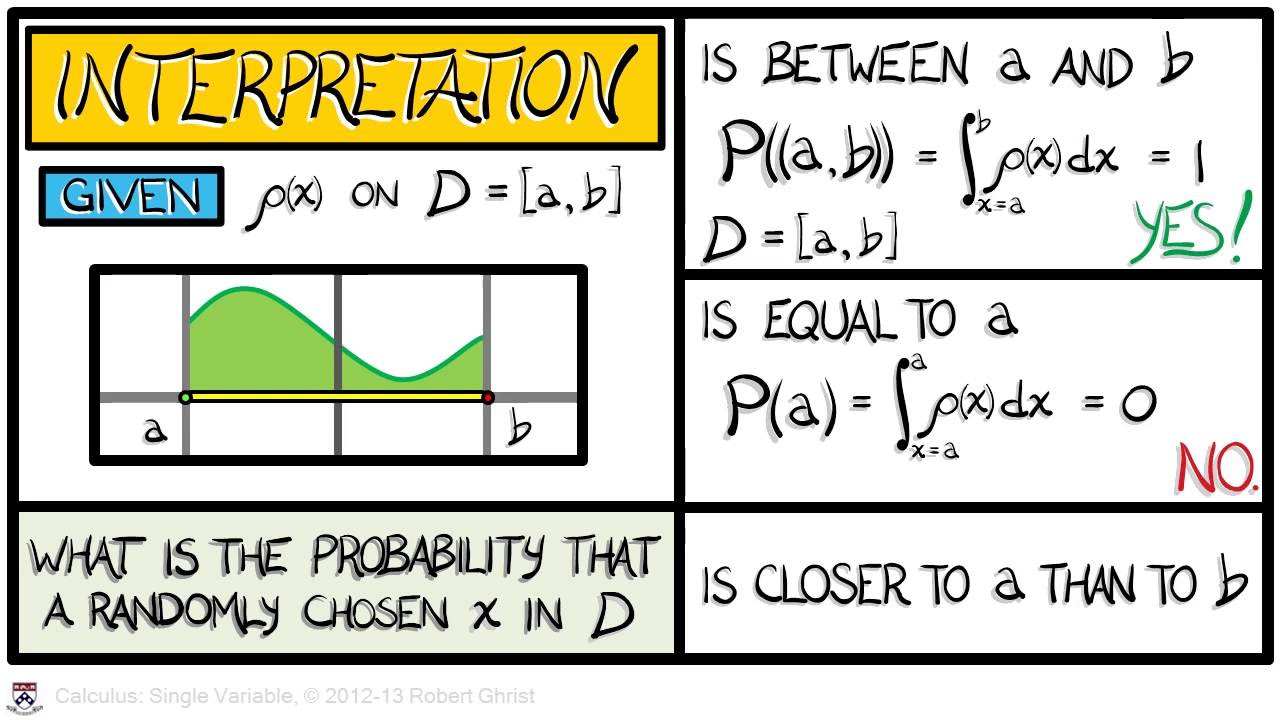
📊 Indicator Notation and Cumulative Distribution Functions
The lecture introduces indicator notation, which is crucial for rewriting probability density functions (pdfs) in a more streamlined manner. The indicator function is defined, and its use in both discrete and continuous distributions is demonstrated. The cumulative distribution function (cdf) is also explained, showing how it represents the probability that a random variable is less than or equal to a certain value. The cdf is derived from the pdf for continuous variables and is characterized as a step function for discrete variables.
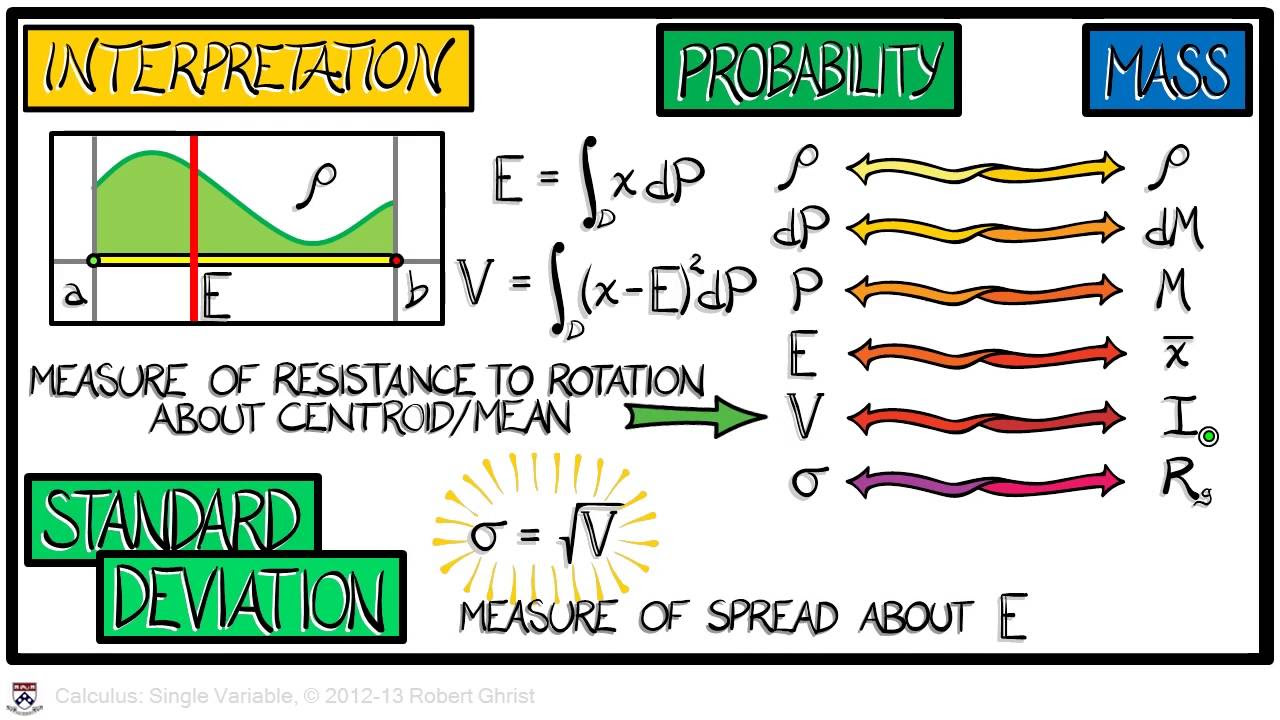
🧮 Expected Value and Final Remarks
The final topic covered is the expected value, or mean, of a distribution, which is described as a probability-weighted average. The instructor notes that the concept will be further explained in subsequent classes. The lecture concludes with a reminder about the video upload and an expression of gratitude to the students for their participation.
Mindmap
Keywords
💡Mathematical Statistics
💡Probability
💡Statistics
💡Random Variables
💡Bernoulli Distribution
💡Exponential Distribution
💡Indicator Function
💡Cumulative Distribution Function (CDF)
💡Parameter Estimation
💡Confidence Intervals
💡Hypothesis Testing
Highlights
The course focuses on mathematical statistics, which is a theoretical course revolving around probability and its application in statistics.
The professor emphasizes that mathematical statistics is their all-time favorite course to teach, showcasing their enthusiasm for the subject.
The course aims to explore the foundations of statistical tests, such as t-tests, and the assumptions behind them.
Students will learn to create their own statistical tests and rules, potentially to be used by students in introductory statistics courses.
The course will initially resemble a probability course, delving into estimation of parameters before moving on to confidence intervals and hypothesis tests.
The professor clarifies the difference between probability, which is about the future, and statistics, which involves analyzing past data.
The course will cover proofs and theorems, indicating a rigorous and mathematical approach to statistical theory.
The professor has written their own textbook for the course, which is a work in progress and is recommended for download.
A distributions button on the course page is highlighted as a crucial resource for students, potentially to be printed and laminated for frequent use.
The course grading is weighted towards homework, midterms, and a final exam, with an emphasis on the importance of attending midterms.
The course 5530 is an in-depth version of course 5520, with a faster pace, more depth, and additional topics.
Homework assignments will be released on Wednesdays, with a lenient policy on late submissions, though the professor encourages punctuality.
The first homework is already posted and serves as a prerequisite review, covering sections one through seven of chapter zero in the course notes.
The concept of random variables is introduced as mappings from the outcomes of an experiment to real numbers.
The Bernoulli distribution is discussed as a special case of random variables, where outcomes are binary.
The professor introduces the concept of a probability density function (pdf) for both discrete and continuous random variables.
The exponential distribution is presented as an important continuous distribution, particularly in the context of Markov processes.
Indicator notation is introduced as a method to simplify the representation of pdfs, which will be particularly useful in the course.
The cumulative distribution function (cdf) is explained as a function that gives the probability that a random variable is less than or equal to a certain value.
The concept of expected value is briefly mentioned, with the promise of a more in-depth explanation in subsequent classes.
Transcripts
Browse More Related Video
Session 40 - Probability Distribution Functions - PDF, PMF & CDF | DSMP 2023

5. Discrete Random Variables I
Calculus Chapter 4 Lecture 44 Expectation and Variance
1. Introduction to Statistics
Calculus Chapter 4 Lecture 43 Probability Densities
Lecture 7: Gambler's Ruin and Random Variables | Statistics 110
5.0 / 5 (0 votes)
Thanks for rating: