Calculus Chapter 4 Lecture 44 Expectation and Variance
TLDRIn this calculus lecture, Professor Gist explores the concepts of expectation and variance in the context of probability density functions (PDFs). He draws an analogy between mass and probability, explaining how expectation can be seen as a probabilistic centroid and variance as a measure of resistance to rotation, akin to moment of inertia. The lecture delves into the mathematical definitions and calculations for expectation and variance, using examples from uniform and exponential PDFs, and touches on the significance of Gaussian distributions in statistics. The professor also discusses the practical implications of these concepts, such as estimating the likelihood of a light bulb failing within a certain time frame.
Takeaways
- 📚 The lecture introduces the concepts of expectation and variance in the context of probability density functions (PDFs).
- 📉 The expectation, also known as the mean or expected value, is defined as the integral of x times the PDF over its domain, representing the average outcome.
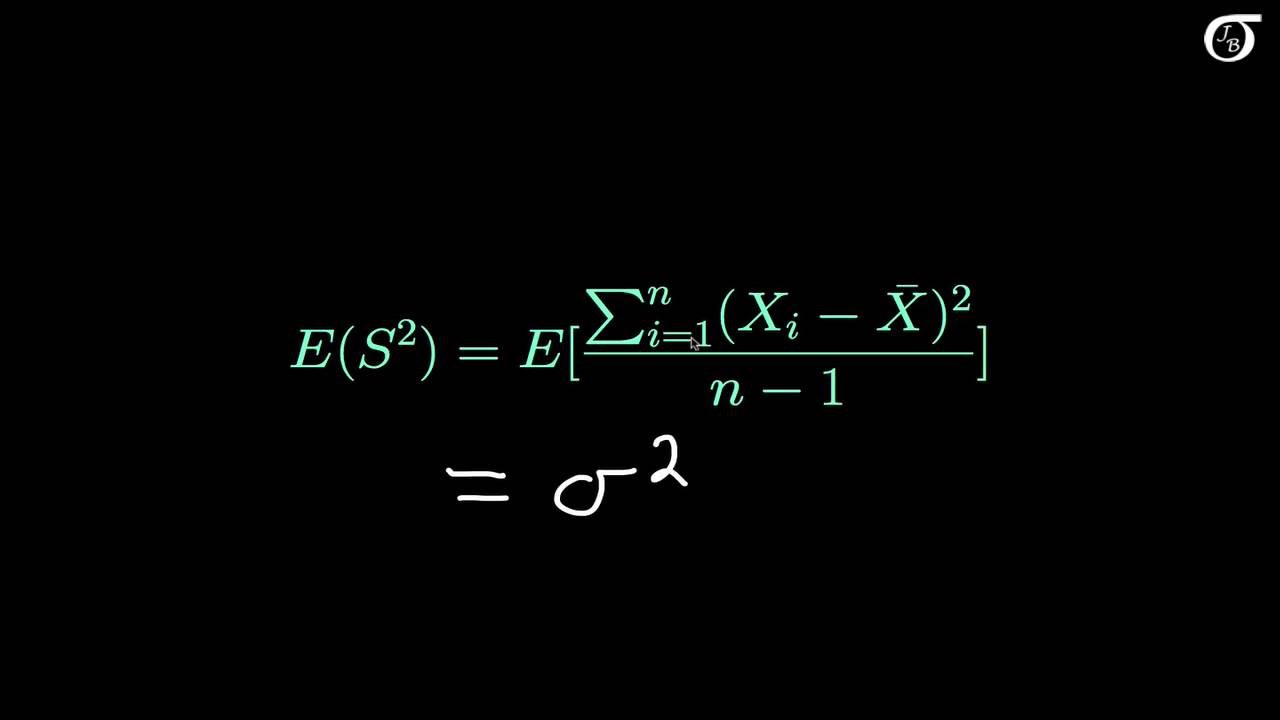
- 📊 Variance, sometimes called the second central moment, measures the spread of the PDF around the mean and is defined as the integral of (x - expectation) squared times the PDF.
- 🔍 The formula for variance can be simplified using the previously found expectation and the integral of the PDF over its domain, which equals one.
- 🌐 The analogy between mass and probability is drawn, with the expectation being likened to the centroid in a physical context.
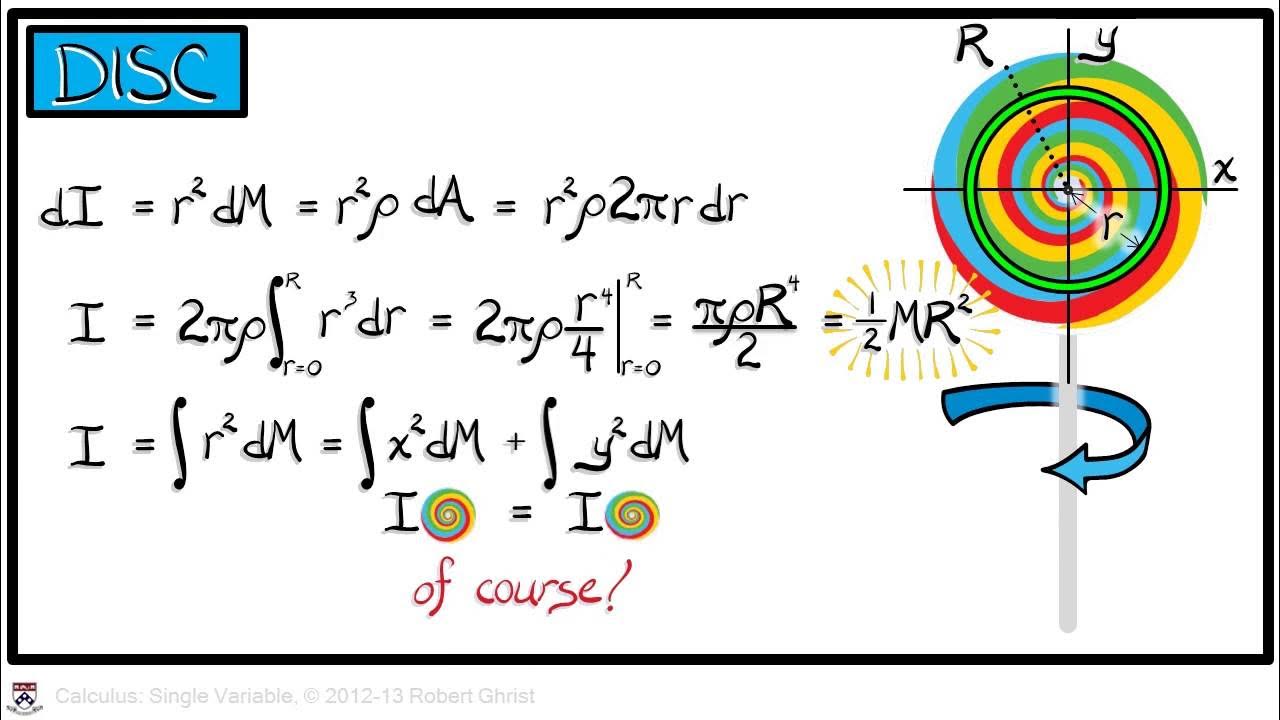
- 🌀 The variance is related to the moment of inertia about the centroid, offering a physical interpretation of the concept as a measure of resistance to rotation.
- 📏 The standard deviation, the square root of variance, is introduced as a measure of the spread of the distribution around the mean.
- 📘 The computation of expectation and variance for a uniform PDF over an interval [A, B] is demonstrated, with the expectation being the midpoint (A+B)/2.
- 📊 For a uniform PDF, the variance is shown to be (B - A)^2 / 12, which relates to the moment of inertia for a rectangle in a physical context.
- 📈 The expectation for an exponential PDF is derived to be 1/α, where α is the rate parameter, and the variance simplifies to 1/α^2.
- 💡 An example of applying the exponential PDF is given, where the probability of a light bulb failing within a certain time is calculated based on its average lifespan.
- 📊 Gaussian or normal densities are highlighted for their ubiquity in representing many natural phenomena and their properties, such as the 68-95-99.7 rule, are briefly mentioned.
Q & A
What is the main topic of Professor Gist's lecture 44?
-The main topic of the lecture is expectation and variance in the context of probability density functions (PDFs), exploring the analogy between masses and probabilities and introducing concepts like mean, standard deviation, and moment of inertia.
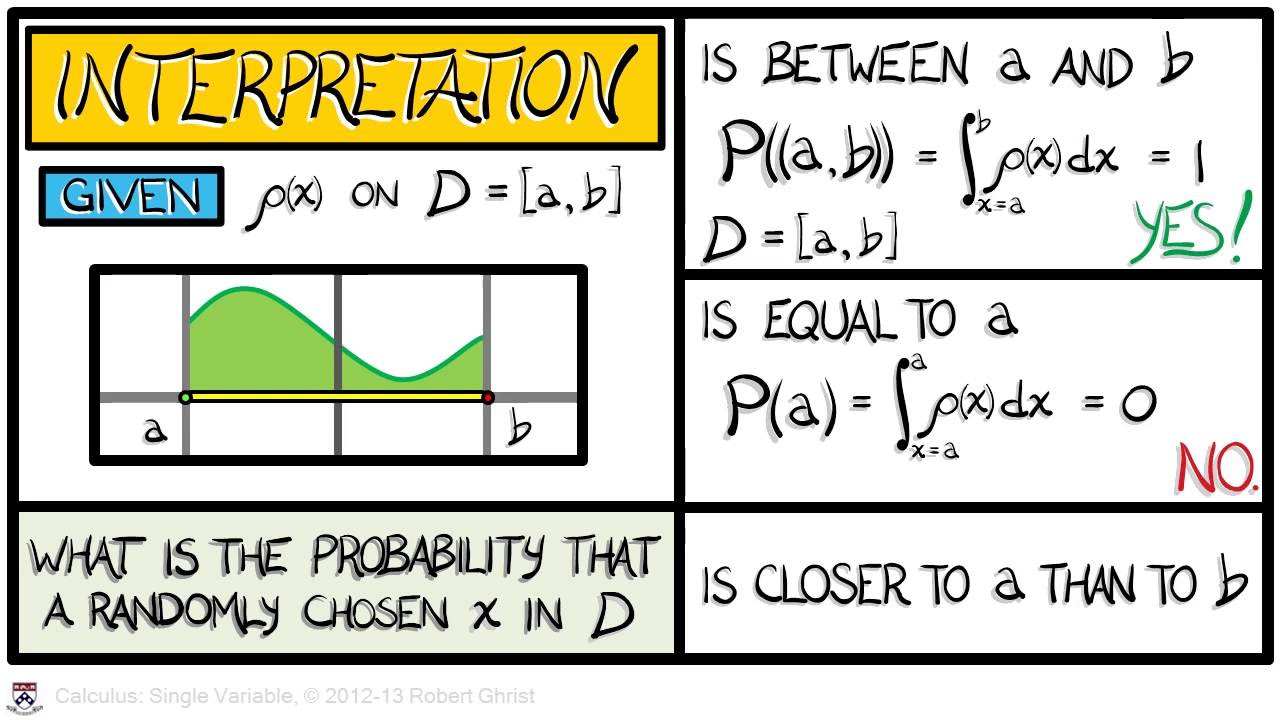
Why is the term 'probability density function' used?
-The term 'probability density function' is used because it shares an analogy with mass density in a physical context, where the mass element is analogous to the probability element.
What is the expectation in the context of a PDF?
-The expectation, also known as the mean or expected value, is a measure of the average or most likely value of a random variable with respect to its PDF. It is defined as the integral of x times the PDF over the domain.
How is the variance related to the concept of moment of inertia?
-The variance can be thought of as the moment of inertia in a probabilistic context, measuring the resistance to rotating the domain about its mean, which is analogous to the physical concept of moment of inertia about an axis.
What is the standard deviation and how is it related to variance?
-The standard deviation, denoted by Sigma, is the square root of the variance. It measures the spread of the distribution about the expectation and is a probabilistic interpretation of the radius of gyration.
What is the formula for the expectation of a uniform density function over an interval from A to B?
-The expectation for a uniform density function is given by the formula (A + B) / 2, which is the midpoint of the interval.
How can you calculate the variance of a uniform density function?
-The variance of a uniform density function can be calculated using the formula (B - A)^2 / 12, which involves the square of the difference between the interval endpoints.
What is the expected lifespan of a light bulb if the probability density function is exponential with an average lifespan of 2,000 hours?
-The expected lifespan is given by the reciprocal of the rate parameter alpha, which in this case is 1/2,000 hours, confirming the advertised average lifespan.
How do you calculate the probability of a light bulb failing within 400 hours given an exponential PDF with an average lifespan of 2,000 hours?
-The probability is calculated by integrating the exponential PDF from 0 to 400 hours, which results in 1 - e^(-5), approximately 0.18 or an 18% chance of failure within the first 400 hours.
What are the general properties of a Gaussian or normal distribution?
-A Gaussian distribution is characterized by its mean (mu) and standard deviation (sigma). It is symmetric and bell-shaped, with about 68% of the mass within one standard deviation of the mean, 95% within two standard deviations, and over 99% within three standard deviations.
Why are Gaussian distributions significant in statistics and probability?
-Gaussian distributions are significant because many natural phenomena and measurements, such as the size of objects or human height, are distributed according to a Gaussian pattern, making it a fundamental concept in statistics and probability.
Outlines
📚 Introduction to Expectation and Variance in Calculus
Professor Gist begins Lecture 44 by introducing the concepts of expectation and variance in the context of calculus. He explains the use of the term 'probability density function' and draws an analogy between mass and probability. The lecture covers the definitions of expectation (mean or expected value) and variance, which are fundamental statistical concepts. The expectation is calculated as the integral of x times the probability density function over the domain, indicating the most likely or average value. Variance, on the other hand, quantifies the uncertainty around the expected value and is defined as the integral of the squared distance from the mean, simplified to the integral of x^2 times the PDF minus the expectation squared. The professor also relates these concepts to physical concepts of mass and moment of inertia, providing a visual and interpretative framework for understanding these statistical measures.
🔍 Physical Interpretation of Expectation and Variance
In this section, Professor Gist explores the physical interpretation of expectation and variance, likening them to the centroid and moment of inertia in a physical system. The expectation is equated to the probabilistic centroid, while the variance is likened to the moment of inertia about the centroid. This analogy helps in understanding the variance as a measure of resistance to rotation about the mean. The standard deviation, as the square root of variance, is introduced as a measure of the spread of the distribution about the expectation. The professor then applies these concepts to calculate the expectation and variance for a uniform probability density function over an interval, finding that the expectation is the midpoint of the interval and the variance is proportional to the square of the interval's length.
📈 Calculation of Expectation and Variance for Exponential Density
The professor moves on to calculate the expectation and variance for an exponential probability density function over the domain from 0 to infinity. Using integration by parts, the expectation is found to be 1/alpha, a simple result that is important for understanding exponential distributions. The variance calculation is more complex, involving a double integration by parts, but it simplifies to 1/alpha^2, leading to a standard deviation of 1/alpha. This section also includes a practical example of a light bulb with an average lifespan, demonstrating how to calculate the probability of failure within a certain time frame using the exponential PDF.
📊 Gaussian Densities and Their Statistical Properties
In the final paragraph, Professor Gist discusses Gaussian or normal densities, their properties, and their prevalence in various statistical distributions. The general form of a Gaussian density is presented, with parameters for mean and standard deviation. The professor emphasizes the importance of understanding the Gaussian distribution, as it is often used in statistics to model natural phenomena. Key properties of the Gaussian distribution, such as the proportion of the distribution within one, two, or three standard deviations of the mean, are highlighted. The lecture concludes with a reflection on the applications covered in the course and a preview of the next chapter, which will integrate the concepts of calculus with discrete functions.
Mindmap
Keywords
💡Probability Density Function (PDF)
💡Expectation
💡Variance
💡Standard Deviation
💡Moment of Inertia
💡Uniform Density
💡Exponential Density
💡Gaussian Density
💡Integration by Parts
💡Centroid
Highlights
The lecture explores the analogy between masses and probabilities, focusing on expectation and variance in the context of probability density functions (PDFs).
Expectation, also known as mean or expected value, is defined as the integral of x times the PDF over the domain, indicating the most likely or average value.
Variance, sometimes called the second central moment, quantifies the uncertainty of the expected value and is defined as the integral of (x - expectation) squared times the PDF.
The formula for variance can be simplified to the integral of x^2 times the PDF minus the expectation squared, an important formula for understanding variation.
A physical interpretation of variance is as a measure of resistance to rotating the domain about its mean, akin to the moment of inertia in physics.
The standard deviation, the square root of variance, measures the spread of the distribution about the expectation, similar to the radius of gyration in mass distribution.
For a uniform PDF over an interval from A to B, the expectation is calculated as (A + B) / 2, placing the average value at the midpoint of the domain.
The variance of a uniform PDF is derived as (B - A)^2 / 12, with the standard deviation being (B - A) / √3, related to the moment of inertia of a rectangle.
An exponential PDF's expectation is calculated as 1/α, where α is the rate parameter, a simple and common result in probability.
The variance for an exponential PDF is 1/α^2, leading to a standard deviation of 1/α, a key result for understanding exponential distributions.
A real-world example of an exponential PDF is the lifespan of a light bulb, where the probability of failure within a certain time can be calculated using the exponential function.
Gaussian or normal densities are ubiquitous in statistics, often used to model the distribution of sizes of objects like people or snowflakes.
A general Gaussian distribution is characterized by its mean (μ) and standard deviation (σ), allowing for tuning these parameters to fit various data sets.
Properties of Gaussian distributions include the fact that approximately 68% of the mass lies within one standard deviation of the mean, and 95% within two standard deviations.
The lecture concludes by emphasizing the broad applications of calculus in probability and statistics, and the upcoming final chapter will integrate the course content.
Transcripts
Browse More Related Video
Calculus Chapter 4 Lecture 43 Probability Densities

Mathematical Statistics, Lecture 1
Calculus Chapter 4 Lecture 41 Moments & Gyration
Proof that the Sample Variance is an Unbiased Estimator of the Population Variance

Session 40 - Probability Distribution Functions - PDF, PMF & CDF | DSMP 2023
Conditional Expectation-I
5.0 / 5 (0 votes)
Thanks for rating: