Cardiovascular | EKG Basics
TLDRThis comprehensive video script delves into the intricacies of the electrocardiogram (EKG), a vital diagnostic tool for clinicians. It emphasizes the importance of understanding EKG for detecting arrhythmias and myocardial infarctions. The script guides viewers through the basics of cardiac electrical activity, explaining how it translates into graphical representations on EKGs. It covers the cardiac conduction system, action potentials, and the role of electrodes in capturing this activity. The explanation continues with the significance of EKG waves (P wave, PR interval, QRS complex, ST segment, and T wave), each corresponding to specific phases of cardiac electrical activity. Furthermore, the script explores different types of leads (bipolar, augmented unipolar, and precordial) that provide a three-dimensional view of the heart's electrical activity. It concludes with the practical application of EKG leads in detecting heart conditions, highlighting the importance of knowing where to place electrodes and how each lead views the heart's electrical activity. The script is an invaluable resource for anyone seeking a deeper understanding of EKGs and their clinical applications.
Takeaways
- 📊 EKG is a crucial diagnostic tool for clinicians to identify arrhythmias and possible myocardial infarctions.
- 💡 Understanding the basics of the electrical activity of the heart is essential for interpreting EKGs.
- 🔌 EKGs graphically represent the heart's electrical activity, detected by electrodes placed on the body.
- 📈 Positive deflections on an EKG occur when electrical activity moves towards a positive electrode.
- 📉 Negative deflections result when electrical activity moves away from a positive electrode.
- 🏔️ A flat line on an EKG could indicate slow conduction or electrical activity moving perpendicular to the electrode axis.
- 🧭 Lead II is a specific view of the heart's electrical activity, with the positive electrode at the heart's apex and the negative at the base.
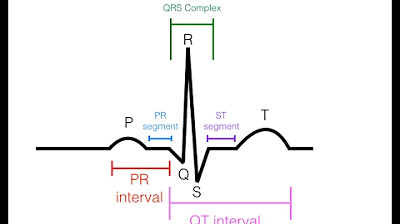
- 🔵 The P wave on an EKG represents atrial depolarization, moving towards the AV node.
- 🚫 The PR interval reflects the slow conduction through the AV node, with no net electrical vector.
- 🤜 The QRS complex indicates ventricular depolarization, with the R wave representing the mean vector generated between the left and right ventricles.
- 🔁 The ST segment and T wave represent the period of repolarization of the ventricles after depolarization.
Q & A
What is the primary purpose of an ECG?
-The primary purpose of an ECG is to provide a graphical representation of the heart's electrical activity, which is crucial for diagnosing arrhythmias and potential myocardial infarctions.
How does an electrode in an ECG work?
-An electrode in an ECG works by picking up the electrical activity of the heart. If the electrical activity moves towards the positive electrode, it produces a positive deflection. Conversely, if it moves away from the positive electrode, it results in a negative deflection.
What does the P wave on an ECG represent?
-The P wave on an ECG represents atrial depolarization, which is the electrical activity starting from the SA node and moving towards the AV node.
What is the PR interval on an ECG?
-The PR interval on an ECG is the period during which the electrical activity is conducted slowly through the AV node. It is represented as a flat line or isoelectric line on the ECG.
What does the QRS complex indicate on an ECG?
-The QRS complex on an ECG indicates ventricular depolarization, which includes the Q wave (septal depolarization), the R wave (mean QRS vector generated between the resultant of the left and right ventricle), and the S wave (depolarization at the bases of the ventricles).
What is the significance of the ST segment on an ECG?
-The ST segment on an ECG represents the period when the entire ventricular myocardium is depolarized but has not yet entered the repolarization state, hence it is isoelectric.
What does the T wave on an ECG signify?
-The T wave on an ECG signifies the repolarization of the ventricles, indicating the movement of electrical charges from positive to negative as the heart returns to its resting state.
How many leads make up a standard 12-lead ECG system?
-A standard 12-lead ECG system consists of three bipolar limb leads (I, II, III), three augmented unipolar limb leads (AVR, AVL, AVF), and six precordial or chest leads (V1 to V6).
What are the three bipolar limb leads in an ECG?
-The three bipolar limb leads in an ECG are Lead I (right arm negative, left arm positive), Lead II (right arm negative, left leg positive), and Lead III (left arm negative, left leg positive).
How do the augmented unipolar limb leads (AVR, AVL, AVF) differ from the bipolar limb leads?
-Augmented unipolar limb leads differ from bipolar limb leads in that they utilize a single positive electrode and two negative electrodes, creating a vector between the two negative points. This allows for a different perspective of the heart's electrical activity, viewing it from the right side (AVR), left side (AVL), or inferior view (AVF).
What is the role of chest leads (V1 to V6) in an ECG?
-Chest leads (V1 to V6) provide a view of the heart in the horizontal plane, detecting electrical activity from different regions of the heart. V1 and V2 primarily detect activity from the interventricular septum, V3 and V4 from the anterior wall, and V5 and V6 from the left lateral wall.
Outlines
📈 Understanding EKG Basics
This paragraph introduces the importance of EKG as a diagnostic tool for clinicians. It highlights the need to understand the electrical activity of the heart, vectors, and their graphical representation on EKGs. The focus is on the basics of cardiac conduction and action potentials to correlate electrical activity with EKG readings.
🫀 Lead II in Cardiac Monitoring
This section explains the concept of a lead in EKG, focusing on Lead II. It describes the placement of positive and negative electrodes at the heart's apex and base, respectively. The electrical activity from the SA node to the AV node is discussed, highlighting how it moves towards the positive electrode to produce a positive deflection, identified as the P wave.
📊 PR Interval and AV Node Conduction
This part delves into the PR interval, which represents the delay at the AV node before action potentials move to the Bundle of His. It explains the significance of the PR interval in diagnosing heart blocks and emphasizes the absence of deflection during this period due to the slow conduction through the AV node.
🔋 Q Wave and Ventricular Depolarization
This paragraph covers the depolarization of the interventricular septum, primarily by the left bundle branch. It introduces the Q wave, explaining that it represents septal depolarization and appears as a negative deflection due to the direction of electrical activity.
📉 R Wave and Mean QRS Vector
This section describes the generation of the R wave, which is a positive deflection resulting from the depolarization of the ventricles. The resultant vector, influenced by the thicker left ventricle, points downwards and slightly to the left, producing a prominent positive deflection on the EKG.
🚀 S Wave and ST Segment
The focus here is on the S wave, indicating depolarization at the bases of the ventricles. Following this, the ST segment is described as the period when the entire ventricular myocardium is depolarized and hasn't yet repolarized, resulting in an isoelectric line.
🌊 T Wave and Cardiac Repolarization
This part explains the T wave, which represents the repolarization of the ventricles. The T wave appears as a positive deflection due to the movement of negative charges away from the positive electrode. The paragraph concludes with a summary of the different EKG components discussed.
📐 Understanding EKG Leads
This paragraph introduces the concept of a 12-lead EKG system, including bipolar limb leads, augmented unipolar limb leads, and chest leads. It emphasizes the importance of these leads in providing a comprehensive three-dimensional view of the heart's electrical activity.
🧩 Bipolar Limb Leads Explained
This section details the placement and function of the three bipolar limb leads (Lead I, II, III). It explains how these leads are positioned on the right arm, left arm, and left leg, and how they provide different views of the heart's electrical activity from various angles.
🌀 Augmented Unipolar Limb Leads
This part discusses the augmented unipolar limb leads (aVR, aVL, aVF), describing how the EKG machine generates these leads by creating negative electrodes at two points and a positive electrode at another. It explains the perspectives from which each lead views the heart.
📍 Placement of Chest Leads
This paragraph describes the correct placement of the six chest leads (V1 to V6) on the patient's chest. It emphasizes the significance of each lead in capturing the electrical activity of different parts of the heart, including the septum, anterior wall, and left lateral wall.
Mindmap
Keywords
💡EKG (Electrocardiogram)
💡Cardiac Conduction System
💡SA Node (Sinoatrial Node)
💡AV Node (Atrioventricular Node)
💡Action Potential
💡P Wave
💡QRS Complex
💡T Wave
💡Lead
💡PR Interval
💡Bipolar Limb Leads
💡Augmented Unipolar Limb Leads
💡Chest Leads
💡Einthoven's Triangle
💡ST Segment
Highlights
Introduction to the basics of EKG as an essential diagnostic tool for clinicians.
Explanation of EKG's role in detecting arrhythmias and possible myocardial infarctions.
Discussion on the electrical activity of the heart and its representation through vectors on EKG.
Understanding the cardiac conduction system and its relevance to EKG interpretation.
Clarification on the basics of electrodes and their function in capturing cardiac electrical activity.
Illustration of how positive and negative electrodes create deflections on the EKG.
Description of the cardiac action potentials and their correlation with EKG readings.
Importance of the P wave on EKG as indicative of atrial depolarization.
Explanation of the PR interval and its significance in diagnosing heart blocks.
Identification of the Q wave on EKG as representing septal depolarization.
Role of the R wave in indicating ventricular depolarization explained.
Significance of the S wave as indicative of the depolarization of the bases of the ventricles.
Description of the ST segment as the period when the ventricular myocardium is depolarized but not yet repolarized.
Importance of the T wave in representing the repolarization of the ventricular myocardium.
Overview of the 12-lead EKG system and its comprehensive view of the heart's electrical activity.
Differentiation between bipolar limb leads, augmented unipolar limb leads, and precordial leads in a 12-lead EKG.
Explanation of how the leads provide a three-dimensional view of the heart in both frontal and horizontal planes.
Importance of lead placement for accurate EKG readings and diagnosis.
Summary of the video's educational content on EKG basics for clinical understanding.
Transcripts
Browse More Related Video

EKG Basics | How to Read & Interpret EKGs: Updated Lecture

How to Read an ECG | ECG Interpretation | EKG | OSCE Guide | UKMLA | CPSA
EKG/ECG Interpretation (Basic) : Easy and Simple!

Pulseless Electrical Activity (PEA) – Emergency Medicine | Lecturio

Cardiovascular | Cardiac Cycle

MASTER ECG/EKG INTERPRETATION: A Systematic Approach for 12 Lead ECG/EKGs | Retired
5.0 / 5 (0 votes)
Thanks for rating: