MASTER ECG/EKG INTERPRETATION: A Systematic Approach for 12 Lead ECG/EKGs | Retired
TLDRThis comprehensive video script offers an in-depth exploration of the 12-lead ECG, a crucial diagnostic tool in cardiology. The presenter systematically guides viewers through the process of interpreting ECGs, starting with foundational concepts such as the identification of different waveforms (P wave, QRS complex, T wave, and QT interval) and their implications on heart activity. The discussion then delves into the practical aspects of ECG reading, including determining heart rate and rhythm, assessing the PR interval, and evaluating the ST segment for signs of ischemia or infarction. The script also emphasizes the importance of recognizing various abnormalities like bundle branch blocks, hypertrophy, and the significance of axis deviation in diagnosing conditions like Wolff-Parkinson-White Syndrome. The presenter's methodical approach, paired with clear explanations and a touch of humor, makes this an engaging and informative resource for medical professionals or students aiming to master ECG interpretation.
Takeaways
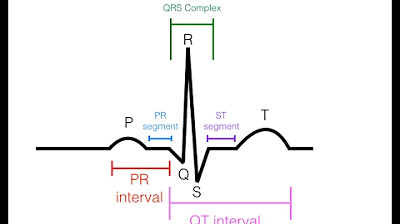
- 📊 Understanding the basics of an ECG is crucial for interpreting it effectively. Key components include the P wave (atrial depolarization), PR segment (AV node depolarization), QRS complex (ventricular depolarization), ST segment (no net electrical movement), T wave (ventricular repolarization), and QT interval (time from ventricular depolarization to repolarization).
- 🧵 Electrodes and leads are used to pick up the heart's electrical activity. There are three bipolar limb leads (I, II, III), three augmented unipolar limb leads (aVF, aVL, aVR), and six precordial chest leads (V1 to V6), making up the 12 leads of an ECG.
- 📏 The ECG paper has a standard size for boxes: a large box is 5mm x 5mm, representing 0.5 millivolts in height and 0.2 seconds in width. Small boxes are 1mm x 1mm, representing 0.1 millivolts and 0.04 seconds, respectively.
- 💡 To determine the heart rate, count the number of R waves in a 10-second rhythm strip and multiply by 6, or use the box method by counting the number of small boxes between successive R waves.
- 🔍 Rhythm can be regular or irregular. Regular rhythm means there is a consistent R-to-R interval, while irregular rhythm indicates variability.
- 🔎 The QRS complex can be wide or narrow, with a wide QRS being greater than 0.12 seconds (three small boxes) and a narrow QRS being less.
- 🌟 P waves are indicative of sinus rhythm if they are upright in lead II, inverted in aVR, and each P wave is followed by a QRS complex.
- 🤔 Differential diagnosis is important when determining if a patient's heart rate is too fast (tachycardia) or too slow (bradycardia), and whether the rhythm is regular or irregular.
- 🚨 ST segment elevation in certain leads may indicate a myocardial infarction (MI), but other conditions like pericarditis, Prinzmetal's angina, or left bundle branch block (LBBB) can also cause elevation.
- 📉 ST segment depression, especially horizontal, can be a sign of ischemia and requires further investigation.
- ⚠️ T wave inversions, particularly in lead AVL, can be a sign of impending inferior wall MI or other conditions like left ventricular hypertrophy (LVH) with strain, elevated intracranial pressure, or bundle branch blocks.
- 🏥 Pathological Q waves, low voltage QRS complexes, and left or right ventricular hypertrophy (LVH/RVH) are other significant findings on an ECG that suggest underlying cardiac conditions.
Q & A
What is the first positive deflection in an ECG called and what does it indicate?
-The first positive deflection in an ECG is called the P wave, which is indicative of atrial depolarization.
What is the PR segment in an ECG and what does it represent?
-The PR segment is the flat line at the end of the P wave until the QRS complex begins. It represents the time period where electrical activity from the SA node converges and reaches the AV node, which then holds on to the electrical activity without yet sending it to the ventricles.
How is the PR interval measured and what does it represent?
-The PR interval is measured from the beginning of the P wave to the beginning of the QRS complex. It represents the time span from when the SA node fires, depolarizes the atria, depolarizes the AV node, and is ready to send action potentials to the ventricles.
What does the QRS complex in an ECG indicate?
-The QRS complex indicates ventricular depolarization, which is when the electrical activity generated by the AV node causes the ventricles to depolarize.
What is the ST segment in an ECG and what does it signify?
-The ST segment is the flat line following the S wave of the QRS complex and before the T wave. It signifies that the ventricles are still depolarized with no net movement or electrical activity in a particular direction, as they are holding on to the positive charge before repolarization.
What does the T wave in an ECG represent?
-The T wave represents ventricular repolarization, which is the process where the ventricles transition from a positive to a negative charge after the depolarization phase.
How many types of leads are there in a 12-lead ECG and what are they?
-There are three types of leads in a 12-lead ECG: three bipolar limb leads (I, II, III), three augmented unipolar limb leads (AVF, AVL, AVR), and six precordial chest leads (V1, V2, V3, V4, V5, V6).
What is the significance of the QT interval in an ECG?
-The QT interval is significant as it represents the time period where the ventricles are depolarized and repolarized. A prolonged QT interval can be associated with an increased risk of certain heart conditions, including a potentially deadly arrhythmia called Torsades de Pointes.
What are the two methods to determine the heart rate from an ECG strip?
-The two methods to determine the heart rate from an ECG strip are the 'R wave times six' method and the 'box method', which involves counting the number of R waves in a 10-second rhythm strip and multiplying by six, or measuring the distance between R waves in terms of the number of boxes on the ECG paper.
What does the width of the QRS complex indicate in an ECG?
-The width of the QRS complex in an ECG indicates the duration of ventricular depolarization. A wide QRS (greater than 0.12 seconds) can suggest conditions such as bundle branch blocks, hyperkalemia, or ventricular tachycardia.
What are the potential causes of a prolonged PR interval on an ECG?
-A prolonged PR interval on an ECG can be caused by first-degree heart block, Mobitz I (Wenckebach) second-degree heart block, or third-degree (complete) heart block. It can also be seen in conditions like Wolff-Parkinson-White (WPW) syndrome.
How can you determine if there is left or right axis deviation on an ECG?
-Left axis deviation is suggested when the R wave in lead I is upright, and the deflection in lead AVF is downward, with a negative deflection in lead II. Right axis deviation is indicated when there is a downward deflection in lead I and an upright R wave in lead AVF. Extreme right axis deviation is present when both leads I and AVF show a primary negative deflection.
Outlines
📊 EKG Basics and Systematic Approach
The paragraph introduces the foundational concepts of EKG reading, emphasizing the importance of understanding the different deflections and blips in an EKG. It explains the significance of the P wave (atrial depolarization), the PR segment (AV node depolarization), the QRS complex (ventricular depolarization), the ST segment (ventricular depolarization without net movement), the T wave (ventricular repolarization), and the QT interval (time from ventricular depolarization to repolarization). The paragraph also discusses how electrodes and leads are used to capture the heart's electrical activity in various planes.
🔌 EKG Leads and Cardiac Regions
This section delves into the specifics of EKG leads, explaining how they correspond to different parts of the heart. It details the significance of leads II, III, and AVF for the inferior part of the heart, leads I, AVL, V5, and V6 for the lateral wall of the left ventricle, and leads V1, V2, and AVR for the right ventricle. The paragraph also describes the 12 leads used in a standard EKG: three bipolar limb leads, three augmented unipolar limb leads, and six precordial chest leads.
📏 Understanding EKG Paper and Measurements
The paragraph explains the structure of an EKG strip, describing the large and small boxes and their significance in measuring voltage (amplitude) and time. It provides specific measurements, stating that a large box represents 0.5 millivolts in height and 0.2 seconds in width, while a small box represents 0.1 millivolts and 0.04 seconds, respectively. This understanding is crucial for interpreting the electrical activity of the heart.
💡 Rate and Rhythm Analysis in EKG
This section focuses on determining the heart rate and rhythm from a 12-lead EKG. It explains the normal rate (60 to 100 beats per minute), and how to calculate the rate using the R wave times six method or the box method. The paragraph also discusses how to assess the rhythm for regularity or irregularity by measuring the consistency of the R-to-R interval.
🏥 Differential Diagnosis for EKG Readings
The paragraph emphasizes the importance of differential diagnosis when analyzing EKGs, particularly in cases of tachycardia or bradycardia. It outlines a systematic approach to identify various types of tachycardias (such as sinus tachycardia, atrial flutter, and supraventricular tachycardia) and arrhythmias. The discussion also includes identifying wide or narrow QRS complexes and their implications for conditions like ventricular tachycardia (V-Tach) and bundle branch blocks.
🚑 ST Segment Evaluation and Ischemia
This section highlights the importance of examining the ST segment for elevation or depression, which can indicate conditions like myocardial infarction (heart attack) or ischemia. It explains how to measure ST segment elevation from the J point and the significance of different amounts of elevation in various leads. The paragraph also discusses various differentials to consider when ST segment changes are observed.
🏋️♂️ QRS Complex and Ventricular Hypertrophy
The paragraph discusses the analysis of the QRS complex, focusing on identifying left and right ventricular hypertrophy (LVH and RVH) through specific EKG patterns. It explains how to calculate the sum of the R wave and S wave in certain leads to determine if there's hypertrophy. The section also touches on other abnormalities like pathological Q waves, low voltage QRS complexes, and the significance of R wave progression.
🔄 Cardiac Axis and Its Deviations
The final paragraph explains the concept of the cardiac axis, how to determine it using leads I and AVF, and the implications of axis deviation. It describes how to identify normal, left, right, and extreme right axis deviation, and what conditions might cause these deviations, such as bundle branch blocks, ventricular hypertrophy, or other cardiac abnormalities.
Mindmap
Keywords
💡EKG
💡P Wave
💡PR Segment
💡QRS Complex
💡ST Segment
💡T Wave
💡QT Interval
💡Cardiac Axis
💡Bundle Branch Block
💡Ventricular Hypertrophy
💡Arrhythmia
Highlights
Explains the systematic approach to interpreting a 12-lead ECG, emphasizing the importance of understanding the foundational concepts.
Describes the P wave as indicative of atrial depolarization, generated by the SA node and spreading through the atria.
Details the PR segment as the time period representing the convergence of electrical activity at the AV node before it's sent to the ventricles.
Discusses the PR interval as the time span from the SA node firing to the ventricles getting ready to receive action potentials.
Identifies the QRS complex as indicative of ventricular depolarization, with the Q wave, R wave, and S wave representing different phases.
Explains the ST segment as indicative of the ventricles still depolarized and waiting to repolarize with no net electrical movement.
Describes the T wave as indicative of ventricular repolarization, showing the transition from a positive to a negative charge.
Introduces the QT interval as the time period where the ventricles are depolarized and repolarized, which is crucial for assessing arrhythmias.
Discusses the use of electrodes and leads to pick up and register the heart's electrical activity on an ECG graph.
Differentiates between the 12 leads of an ECG, explaining how they provide information about the heart's electrical activity in different planes.
Provides a basic understanding of an ECG strip, explaining the significance of the height and width of the boxes in representing amplitude and time.
Teaches how to determine the heart rate using the R wave times six method and the box method for a quick and accurate assessment.
Explains the importance of assessing the rhythm's regularity by examining the consistency of the R-R intervals.
Differentiates between wide and narrow QRS complexes, which is critical for diagnosing conditions like bundle branch blocks.
Discusses the significance of sinus P waves and how their presence in lead II and inverse in AVR, followed by a QRS complex, indicates sinus rhythm.
Covers the concept of differential diagnosis in ECG interpretation, particularly when the heart rate is too fast or too slow.
Provides criteria for identifying ST segment elevation, a critical marker for potential heart attacks, and discusses its differentials.
Explains the importance of recognizing ST segment depression, which can be an indicator of ischemia and requires immediate attention.
Discusses the significance of T wave inversions, which can be a sign of impending ischemia or infarction and have various differentials.
Introduces the concept of J waves, also known as Osborne waves, and their association with conditions like hypothermia and hypercalcemia.
Covers the analysis of QRS complexes, including identifying wide or narrow complexes, and their implications for conditions like bundle branch blocks.
Explains how to identify and interpret pathological Q waves, which can be a sign of previous or acute myocardial infarction.
Discusses low voltage QRS complexes, which can be a sign of conditions like pericardial effusion, especially in patients with shortness of breath.
Teaches how to assess the R wave progression and dominant R waves in the precordial leads, which can indicate conditions like anterior MI or right ventricular hypertrophy.
Details how to calculate and interpret the QT interval, including recognizing a prolonged QT interval that can lead to serious arrhythmias like Torsades de Pointes.
Explains the concept of cardiac axis deviation, including left, right, and extreme right axis deviation, and their potential causes.
Transcripts
Browse More Related Video


5.0 / 5 (0 votes)
Thanks for rating: