EKG Basics | How to Read & Interpret EKGs: Updated Lecture
TLDRThis comprehensive video script delves into the intricacies of electrocardiogram (ECG) interpretation, a vital skill for medical professionals. The speaker, using the moniker 'ninja nerds,' breaks down the foundational concepts of ECG reading, starting with the physics and physiology underlying the generation of ECG waves. The discussion encompasses the role of the sinoatrial (SA) node, the propagation of electrical signals through the heart's conduction system, and the interpretation of various ECG components, including the P wave, QRS complex, ST segment, and T wave. The script also explains the significance of the ECG's different leads, particularly lead II, in assessing heart activity. It further explores the meaning of deflections and isoelectric lines in the ECG and their correlation with the heart's electrical activity. The video aims to equip viewers with a systematic approach to understanding and analyzing ECGs, emphasizing the importance of recognizing normal patterns and identifying potential abnormalities.
Takeaways
- 😀 Understanding the basics of EKGs involves learning about the physics and physiology of heart depolarization and repolarization.
- 📈 Positive charges moving towards a positive electrode on an EKG produce an upward deflection, while positive charges moving away result in a downward deflection.
- 🧬 Depolarization is the process where cells become positive due to the influx of positive ions like calcium and sodium.
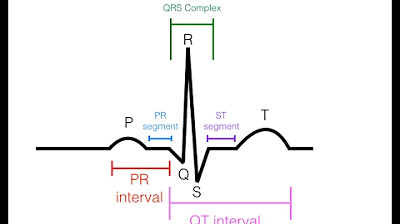
- 🔋 The PR segment on an EKG represents the delay at the AV node, where electrical activity pauses before moving to the ventricles.
- 🫀 The Q wave on an EKG indicates septal depolarization, moving away from the positive electrode, resulting in a downward deflection.
- 🚀 The R wave represents the depolarization of the ventricles, primarily driven by the thicker left ventricle, causing a significant upward deflection.
- 🔄 The S wave reflects the depolarization moving towards the base of the ventricles, resulting in a downward deflection.
- ⚡ The T wave indicates ventricular repolarization, where negative charges move towards the negative electrode, causing an upward deflection.
- 🔍 Limb leads and augmented unipolar limb leads provide different views of the heart's electrical activity, with lead II being the most commonly used in rhythm strips.
- 📏 EKG paper measurements are crucial, with each large box representing 0.20 seconds and each small box 0.04 seconds, essential for determining the duration of intervals like PR and QT.
Q & A
What is the significance of understanding the physics and physiology behind an ECG?
-Understanding the physics and physiology behind an ECG is crucial because it forms the basis for accurately reading and interpreting the 12 lead ECG cases. It helps in systematically approaching ECG analysis and determining what's happening with the heart's electrical activity.
How does depolarization of myocardial cells lead to an electrical signal?
-Depolarization occurs when cells undergo a change and allow positive ions like calcium and sodium to flood into the cells, causing them to become positively charged. This process creates an electrical signal that propagates from one end of the tissue to the other through gap junctions between cells.
What causes a positive deflection on an ECG?
-A positive deflection on an ECG occurs when there is a flow of positive charges moving towards the positive electrode of any lead in the 12 lead system.
What does an isoelectric line on an ECG indicate?
-An isoelectric line, or a flat line, on an ECG indicates that there is no net movement of electrical activity or that the electrical activity of the heart is moving perpendicular to the axis of the lead being observed.
What does the P wave on an ECG represent?
-The P wave on an ECG represents atrial depolarization. If the P wave is upright and has the same morphology throughout, it is known as a sinus P wave, indicating that the SA node generated the electrical activity to depolarize the atria.
What is the PR segment on an ECG?
-The PR segment on an ECG is the period between the end of the P wave and the beginning of the QRS complex. It represents the time it takes for the electrical impulse to travel from the SA node through the atria and reach the AV node.
What does the QRS complex on an ECG indicate?
-The QRS complex on an ECG indicates ventricular depolarization, which is the process where the electrical impulse from the SA node spreads through the ventricles, causing them to contract.
What is the significance of the ST segment on an ECG?
-The ST segment on an ECG represents the time when the entire ventricular myocardium is completely depolarized and is about to begin repolarization. Any changes or abnormalities in the ST segment can indicate various cardiac conditions.
What does the T wave on an ECG represent?
-The T wave on an ECG represents ventricular repolarization, the process by which the ventricles return to their resting state after depolarization.
What is the purpose of the 12 lead system in an ECG?
-The 12 lead system in an ECG allows for a comprehensive view of the heart's electrical activity from different angles. It includes three limb leads, three augmented unipolar limb leads, and six precordial or chest leads, providing a detailed and complete picture of the heart's function.
How do the precordial leads (V1 to V6) contribute to understanding the heart's condition?
-The precordial leads (V1 to V6) provide information about different sections of the heart from a transverse or horizontal plane. They are particularly useful for identifying pathologies such as myocardial infarctions (heart attacks), hypertrophy (enlargement of the heart), and other conditions affecting the ventricles.
Outlines
😀 Introduction to EKG Basics
This paragraph introduces the topic of EKG basics, emphasizing the importance of understanding the physics and physiology behind EKG readings. It uses an analogy of ventricular myocardium with electrodes to explain how electrical signals are generated and propagated through the heart tissue, leading to positive or negative deflections on an EKG. The explanation also covers gap junctions, depolarization, and the significance of the direction of positive charge flow relative to electrodes.
🏥 Understanding EKG Deflections and the Heart's Axis
The speaker delves into how EKG deflections occur, explaining the concept of the heart's axis and its relation to the electrodes. It discusses how the positioning of electrodes affects the EKG's waveform, particularly focusing on lead 2. The paragraph also covers the significance of the P wave, PR segment, and QRS complex in relation to atrial and ventricular depolarization, as well as the importance of the direction of electrical activity in producing EKG readings.
📈 The EKG's PR Interval and Isoelectric Line
This section explains the PR interval, which is the time from the start of the P wave to the beginning of the QRS complex, indicating the delay at the AV node. The paragraph also discusses the isoelectric line, which represents a lack of net electrical movement or activity perpendicular to the lead axis. It further elaborates on the mean vector of atrial depolarization and its impact on the P wave's appearance.
🧠 EKG Waveforms and Ventricular Depolarization
The focus of this paragraph is on the EKG waveforms, particularly the Q wave, which signifies septal depolarization. It also discusses the R wave, which results from the left ventricle's thicker myocardium generating a larger positive deflection. The explanation includes the role of the left and right bundle branches in depolarization and the concept of the mean QRS vector.
🌉 The ST Segment and Ventricular Myocardium
The speaker describes the ST segment as a flat line on the EKG, indicating that the ventricular myocardium is fully depolarized with no net movement of electrical charge. This paragraph emphasizes the importance of the ST segment in pathology and how EKG machines are designed to cancel out equal deflections, resulting in an isoelectric line when electrical activity is perpendicular to the lead axis.
🔋 EKG Lead Systems and Heart's Electrical Activity
This paragraph introduces the concept of EKG lead systems, explaining how they are positioned on the body and their purpose in capturing the heart's electrical activity. It details the three limb leads (Lead I, II, and III) and their respective electrode placements, creating different axes for EKG readings. The speaker also discusses how these leads provide a comprehensive view of the heart's electrical activity.
📊 EKG Waveform Analysis Across Different Leads
The speaker provides an in-depth analysis of EKG waveforms across different leads, noting that Lead II is commonly used in rhythm strips. It explains that while there may be slight variations due to the axis of the leads, the waveforms for Lead I, II, and III should be largely similar. The paragraph also touches on the importance of understanding the direction of electrical activity relative to the positive electrode for each lead.
🏋️♂️ Augmented Unipolar Limb Leads and Their Impact
This section discusses the augmented unipolar limb leads (AVR, AVL, and AVF), which are derived from the same lead system but with modified electrode placements. The speaker explains how the EKG machine switches electrodes to create different views of the heart's electrical activity. It also highlights that AVR is typically the opposite of Lead II, while AVL and AVF resemble Lead I, II, and III.
📍 Precordial Leads and Their Diagnostic Significance
The speaker focuses on the precordial leads (V1 to V6), which are crucial for identifying various cardiac pathologies. It outlines the specific locations for placing these leads on the chest and explains that they are unipolar, meaning they can detect electrical activity moving towards or away from them. The paragraph emphasizes the importance of understanding the R wave progression and the S wave decrease from V1 to V6 for diagnosing conditions like ventricular hypertrophy.
📏 Measuring EKG Intervals and Waves
This paragraph provides a detailed explanation of the EKG's PR interval, QRS complex, QT interval, and ST segment, including their normal measurements and significance. It emphasizes the importance of these intervals for diagnosing different cardiac conditions, such as blocks and arrhythmias. The speaker also provides a method for measuring these intervals using the EKG grid and explains the implications of their durations.
Mindmap
Keywords
💡EKG
💡Depolarization
💡Sinoatrial (SA) Node
💡Atrioventricular (AV) Node
💡Bundle of His
💡QRS Complex
💡ST Segment
💡T Wave
💡Leads
💡Vector
💡Repolarization
Highlights
The basics of ECGs are introduced, including understanding the physics and physiology behind the electrical activity of the heart.
The importance of the flow of positive charges towards or away from electrodes in producing upward or downward deflections on an ECG is explained.
The concept of depolarization and its impact on the ECG waveform, including how gap junctions facilitate the spread of electrical signals across heart cells, is discussed.
The significance of the P wave on an ECG, which indicates atrial depolarization, is detailed.
The PR segment and interval are described, highlighting their role in representing the time taken for electrical activity to travel from the SA node to the AV node.
The Q wave's indication of septal depolarization and its normal versus pathological characteristics are explored.
The RS complex on an ECG, representing ventricular depolarization, is explained, with a focus on the direction of positive charge flow.
The S wave, indicative of ventricular depolarization towards the base of the heart, is discussed in relation to its direction and ECG deflection.
The ST segment is described as a flat line on the ECG, representing the period when the ventricles are completely depolarized with no net movement of electrical charge.
The T wave, which signifies ventricular repolarization, is explained, noting its upward deflection as negative charges move towards the positive electrode.
The concept of Eintoven's triangle is introduced to understand the orientation of the heart in relation to the lead axes for ECG readings.
Lead II is highlighted as the most commonly used lead in rhythm strips of 12-lead ECGs, with its electrode placement and axis demonstrated.
The progression of the R wave from V1 to V6 on precordial leads is detailed, emphasizing its importance in understanding ventricular activity.
The significance of the R/S ratio in leads V1 to V6 for diagnosing conditions like ventricular hypertrophy and axis deviation is discussed.
The placement of precordial chest leads and their importance in identifying different regions of the heart's activity is explained.
The ECG paper's grid system is described, with a focus on the measurement of time and voltage through the width and height of the boxes.
The normal values for the PR interval, QRS complex width, and QT interval are provided, with implications for diagnosing arrhythmias and other heart conditions.
Transcripts
Browse More Related Video

MASTER ECG/EKG INTERPRETATION: A Systematic Approach for 12 Lead ECG/EKGs | Retired

How to Read an ECG | ECG Interpretation | EKG | OSCE Guide | UKMLA | CPSA

How To Read An ECG

Cardiovascular | EKG Basics
EKG/ECG Interpretation (Basic) : Easy and Simple!

EKG Rhythms | ECG Heart Rhythms Explained - Comprehensive NCLEX Review
5.0 / 5 (0 votes)
Thanks for rating: