BusCalc 12.6 Sketching Functions/Graphs
TLDRThe video script is an extensive educational discourse on mathematical concepts, primarily focusing on geometry, calculus, and graph sketching. It begins with a detailed exploration of a water-filled vessel, using geometric principles to derive the volume of water as a function of the vessel's radius. The presenter employs a 45-45-90 triangle to establish relationships between the sides and angles, leading to the volume formula \( v = \frac{\pi r^3}{3} \), where \( h \) (height) is equivalent to \( r \) (radius). The script then transitions into a calculus segment, addressing related rates problems and differentiating equations with respect to time to find rates of change. A step-by-step approach is provided for solving such problems, emphasizing the importance of understanding how different quantities are interconnected. Further, the presenter delves into the process of sketching curves, outlining a nine-step method to analyze and graph functions. This includes finding y-intercepts, x-intercepts, detecting discontinuities, calculating derivatives to find critical points and inflection points, and considering the behavior of the function's first and second derivatives. The method concludes with plotting points and connecting them to form the curve, taking into account the function's concavity and any asymptotic behavior. Throughout the script, the presenter anticipates an upcoming exam, providing a review of topics covered, including derivatives, implicit differentiation, related rates, and curve sketching. The emphasis is on understanding and applying mathematical concepts to solve a variety of problems, with an encouragement to practice and review to prepare for the exam. The script is a testament to the presenter's pedagogical approach, aiming to equip students with the tools and understanding necessary to excel in mathematical problem-solving.
Takeaways
- 📐 The script discusses geometry problems involving a vessel of water and a cone, emphasizing the importance of understanding angles and the properties of a 45-45-90 triangle.
- 🌊 It explains how the volume of water in a vessel can be calculated using the formula v = πr³/3, where h = r, and r is the radius of the water's surface.
- 🔢 The concept of related rates is introduced, showing how to find the rate of change of one quantity with respect to time when given other related rates.
- ⏱️ The derivative of the volume with respect to time is used to find the flow rate of water entering the vessel, which is a key step in solving the problem.
- 📚 The script touches on the topic of exams and reviews, advising students to practice and understand the problems before the exam.
- 📈 The method for sketching curves involves finding y-intercepts, x-intercepts, and critical points, and using the first and second derivatives to determine concavity and inflection points.
- 📉 Discontinuities in a function are noted, including when the denominator is zero or when taking the logarithm of zero or a negative number.
- 🔑 The 'scrappy method' of graphing is introduced as a last resort when all else fails, which involves plotting many points and connecting them.
- 📝 The importance of labeling x-intercepts, y-intercepts, maximums, minimums, and inflection points when graphing is stressed for accuracy in exams.
- 📉 The script also discusses how to identify discontinuities in the derivative and how they relate to the original function's behavior.
- 📌 A step-by-step process is outlined for graphing functions, which includes taking derivatives, finding critical points, and analyzing the concavity of the function.
Q & A
What is the shape of the water in the vessel when viewed from the side?
-The shape of the water in the vessel, when viewed from the side, appears as a cone with a flat top, where the cone is facing directly down.
What is the significance of the 45-degree angle in the triangle formed by the water line and the vessel?
-The 45-degree angle signifies that it is part of a 45-45-90 triangle, which means the two legs of the triangle (the sides opposite the 45-degree angles) are of equal length. This is important for determining the dimensions of the water's surface in the vessel.
How is the height of the water related to the radius of the water's surface in the vessel?
-The height of the water (h) is equal to the radius (r) of the water's surface in the vessel, which is a key relationship used to determine the volume of the water.
What is the formula used to calculate the volume (V) of the water in the vessel?
-The formula used to calculate the volume of the water in the vessel is V = (π * r^3) / 3, where r is the radius of the water's surface.
How does the concept of related rates come into play in the given script?
-The concept of related rates is used to find the rate of change of one quantity (dy/dt) given the rates of change of other related quantities (dx/dt) and their relationships, as shown in the example problem involving x, y, and their derivatives with respect to time.
What is the volumetric flow rate of water entering the vessel, and how is it calculated?
-The volumetric flow rate of water entering the vessel is the rate of change of the volume of water with respect to time (dv/dt). It is calculated using the formula dv/dt = π * r^2 * (dr/dt), where r is the radius of the water's surface and dr/dt is the rate at which the radius is changing with time.
What is the 'scrappy method' of graphing, and when is it recommended to use it?
-The 'scrappy method' of graphing involves choosing a large number of x-values, calculating the corresponding y-values, plotting these points on the xy-plane, and then connecting the dots. It is recommended to use this method when one cannot remember the more complex methods or when faced with a situation where other methods fail to provide a clear graph.
What are the steps involved in sketching a curve of a function?
-The steps involved in sketching a curve of a function include finding the y-intercept, finding the x-intercepts, noting any discontinuities, taking the first derivative, taking the second derivative, finding critical points, determining if critical points are maximums, minimums, or inflection points, noting any discontinuities in the derivative, and plotting and connecting the points to form the curve.
How can the value of a function at a given x-value be found?
-The value of a function at a given x-value can be found by substituting the x-value into the function's equation and calculating the resulting y-value.
What is the purpose of finding the first and second derivatives of a function when sketching its curve?
-The first derivative of a function helps in finding critical points, which can be potential maximums or minimums of the function. The second derivative determines the concavity of the function at the critical points, helping to classify them as maximums, minimums, or inflection points.
What is the role of synthetic division in finding x-intercepts of a cubic function?
-Synthetic division is a method used to divide a polynomial by a linear factor of the form (x - r), where r is a root of the polynomial. When a root is known, synthetic division can be used to simplify the cubic polynomial to a quadratic, making it easier to find the remaining roots or x-intercepts.
Why is it important to identify discontinuities in a function when sketching its curve?
-Identifying discontinuities is important because they indicate points where the function is not defined or has an abrupt change in behavior. These points can significantly affect the shape of the curve and must be accurately represented in the sketch.
Outlines
📐 Geometry and Calculus: Understanding a Water Vessel's Shape
The paragraph begins with a visual representation of a water vessel from a side view, explaining its geometrical properties. The focus is on a 45-45-90 triangle formed by the water's surface and the vessel's walls. The speaker uses the properties of this triangle to derive a formula for the volume of water in the vessel, 'v', in terms of the radius 'r'. The explanation involves the concept of related rates in calculus, where the rate of change of one quantity is related to the rate of change of another.
🧮 Derivatives and Related Rates: Solving for dy/dt
This section delves into calculus, specifically the process of taking derivatives with respect to time 't'. The speaker manipulates an equation involving 'x' and 'y' to find the rate of change of 'y' with respect to time, denoted as dy/dt. By applying the chain rule and substituting known values, the speaker simplifies the equation to solve for dy/dt, which is found to be 1. The explanation serves as a practical example of how calculus is used to solve real-world problems.
🚿 Calculating the Flow Rate of Water into a Vessel
The focus shifts to the rate at which water enters a vessel, symbolized by dv/dt, which represents the change in volume of water over time. The speaker uses the previously established relationship between the height 'h' and radius 'r' of the water's surface to find dv/dt. By differentiating an expression for the volume of water with respect to time and applying the chain rule, the flow rate of water is determined, given the radius and its rate of change.
📚 Exam Preparation: Review and Strategy
The speaker addresses the upcoming exam, providing a review and solutions to practice questions. The exam will cover a range of topics, including derivatives, implicit differentiation, related rates, and curve sketching. The speaker encourages students to attempt the review questions and to understand any mistakes before the exam. The emphasis is on thorough preparation and utilizing available resources to ensure success on the exam.
📈 Sketching Curves: A Step-by-Step Approach
The paragraph outlines a procedure for sketching curves, which involves finding y-intercepts, x-intercepts, and identifying any discontinuities, minimums, maximums, and inflection points. The process includes taking the first and second derivatives of the function and using them to determine the nature of the critical points. The speaker also introduces the 'scrappy method' of graphing, which involves plotting numerous points to sketch a rough graph when more sophisticated methods fail.
🔍 Identifying Roots and Simplifying Equations
The speaker demonstrates how to find x-intercepts by setting y to zero and solving the resulting equation. By employing algebraic techniques, including factoring and synthetic division, the speaker finds the roots of the equation. The quadratic formula is then used to find additional x-intercepts. The process highlights the importance of understanding algebraic structures to solve calculus problems.
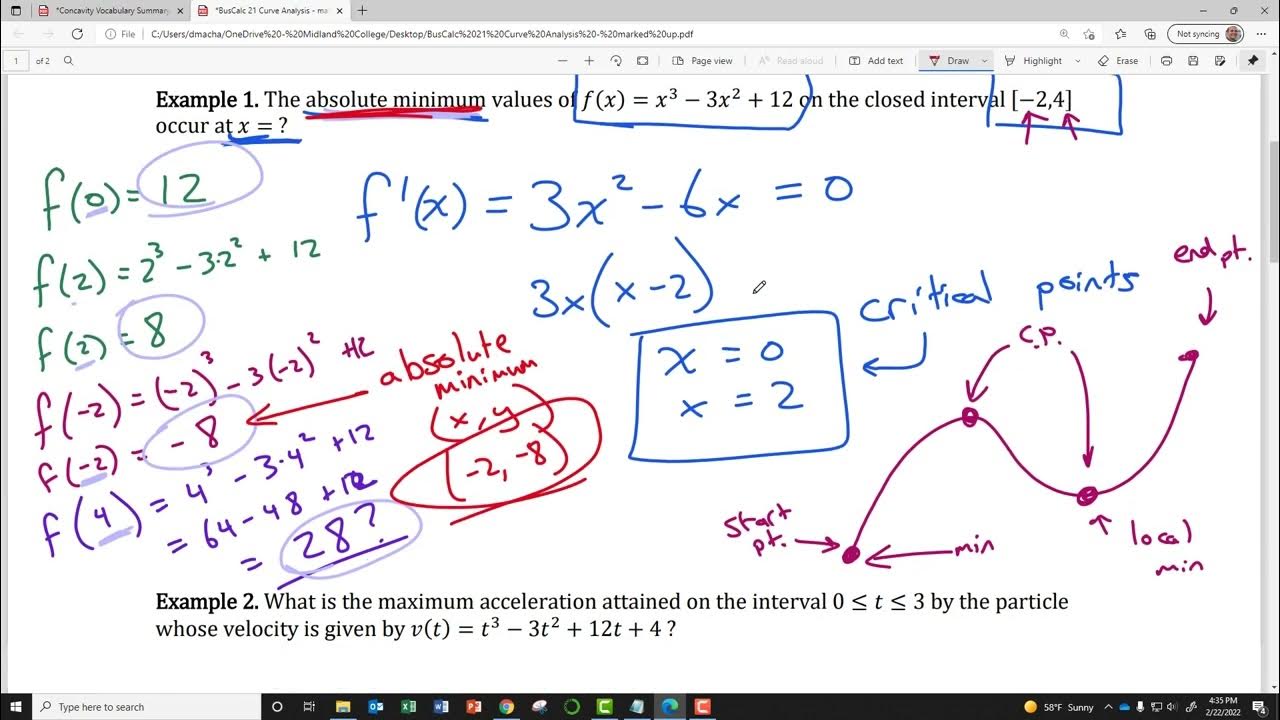
📉 Analyzing a Function's Maximum, Minimum, and Inflection Points
The paragraph describes the process of analyzing a function's critical points by taking its first and second derivatives. The speaker identifies a maximum at the y-intercept and a minimum at another point. The second derivative is used to determine the concavity of the function, which helps in identifying these points. The speaker also calculates the y-values for the maximum, minimum, and an inflection point, providing a comprehensive understanding of the function's behavior.
📋 Sketching a Function's Graph with Key Points
The speaker provides a step-by-step guide to sketching the graph of a function, emphasizing the importance of plotting key points such as y-intercepts, x-intercepts, maximums, minimums, and inflection points. The process includes drawing the x-y plane, plotting the identified points, and connecting them to form the graph. The speaker advises on the accuracy required for an exam and offers strategies for partial credit even if the graph is not perfect.
🔢 Solving for X-Intercepts and Identifying Discontinuities
The paragraph focuses on finding the y-intercept and x-intercepts of a function by substituting values into the equation. The speaker demonstrates solving for x-intercepts by setting the equation equal to zero and simplifying. Discontinuities are identified by looking for values of x that would result in a zero denominator. The process is straightforward, emphasizing the importance of algebraic manipulation in calculus.
📉 Derivatives and the Behavior of a Function
The speaker calculates the first and second derivatives of a function to identify critical points and inflection points. However, in this case, the derivatives reveal that there are no critical points and, consequently, no maximum or minimum values. The second derivative also indicates that there are no inflection points where the function is defined. The speaker emphasizes the importance of understanding the implications of the derivatives on the function's graph.
📈 Sketching a Function with a Vertical Asymptote
The final paragraph discusses the process of sketching a function that has a discontinuity, identified as a vertical asymptote. The speaker uses a combination of the steps outlined previously and some 'scrappy' method by choosing specific x-values, calculating the corresponding y-values, and plotting these points. The graph illustrates the function's behavior, increasing on either side of the discontinuity, with no maximums, minimums, or inflection points present.
Mindmap
Keywords
💡Volume of a cone
💡45-45-90 triangle
💡Related rates problem
💡Implicit differentiation
💡Chain rule
💡Critical points
💡Concavity
💡Inflection point
💡Discontinuities
💡Quotient rule
💡Synthetic division
Highlights
The speaker introduces a geometric problem involving a vessel of water and a cone, using a visual approach to explain the water level and its relationship with the vessel's dimensions.
A 45-45-90 triangle is identified within the vessel's cross-section, which helps in determining the relationship between the height and radius of the water's surface.
The volume of water in the vessel is expressed as a function of the radius, with the formula v = (π * r^3) / 3, where r is the radius of the water's surface.
The concept of related rates is introduced, with an example problem involving the differentiation of x^3 = 9y^5 - 10 with respect to time.
The solution to the related rates problem is found by substituting known values and solving for dy/dt, resulting in dy/dt = 1.
The rate of change of the volume of water with respect to time (dv/dt) is derived, which represents the flow rate of water entering the vessel.
An example calculation shows that the flow rate of water entering the vessel is approximately 12.56 cubic feet per minute, given a radius of 2 feet and a growth rate of 1 foot per minute.
An upcoming exam is discussed, with a review provided covering topics such as derivatives, implicit differentiation, related rates, and curve sketching.
A detailed procedure for sketching curves is outlined, including finding y-intercepts, x-intercepts, discontinuities, and analyzing the first and second derivatives.
The 'scrappy method' of graphing is introduced as a last resort for students who struggle with remembering the steps for curve sketching.
An example is provided to demonstrate the curve sketching procedure, including the calculation of y-intercepts, x-intercepts, and critical points.
The importance of labeling all features of the graph, such as x-intercepts, y-intercepts, maxima, minima, and inflection points, is emphasized for exam preparation.
The process of synthetic division is briefly mentioned as a method to simplify a cubic equation after finding one root.
The use of a calculator to find precise values for x-intercepts when dealing with square roots is suggested for exam purposes.
The concept of concavity is used to determine whether critical points are maxima, minima, or inflection points by analyzing the second derivative.
The final step in the curve sketching procedure involves checking for discontinuities in the derivative that do not correspond to the original function.
A second example of curve sketching is provided, emphasizing the importance of plotting points and understanding the function's behavior around discontinuities and asymptotes.
The speaker reassures students that partial credit will be given for effort and work done, even if the curve sketching does not yield all possible information.
Transcripts


5.0 / 5 (0 votes)
Thanks for rating: