Finding a sample proportion and the corresponding confidence interval
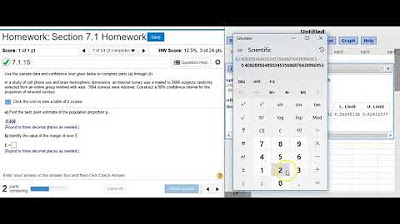
TLDRIn this informative video, Professor Curtis from Aspire Mountain Academy offers a step-by-step guide on how to calculate a sample proportion and construct a 90% confidence interval. Using a hypothetical survey of 3363 adults aged 57 to 85, where 89.4% reported using at least one prescription medication, the video demonstrates the mathematical process of converting percentages to decimals and rounding to obtain a whole number of subjects. It then shows how to use StatCrunch to construct a confidence interval for the sample proportion. The video concludes by addressing the question's relevance to college students, emphasizing the importance of a representative sample for accurate population conclusions. Professor Curtis encourages viewers to engage with the content, providing feedback or suggestions for improvement.
Takeaways
- 📚 Professor Curtis from Aspire Mountain Academy is providing a statistics homework help session focusing on sample proportions and confidence intervals.
- 🧮 To find out how many subjects used at least one prescription medication, multiply the total number of subjects (3363) by the given proportion (89.4%) and round to the nearest whole number.
- 🔢 Convert the percentage to a decimal by moving the decimal point two places to the left before performing the multiplication.
- ✅ The calculated number of subjects using medication is 3007 after rounding up from 0.522.
- 📊 For constructing a 90% confidence interval, use a statistical software like StatCrunch, which can handle summary statistics without raw data.
- 📐 In StatCrunch, select 'Proportion Stats' and 'One Sample' with the 'With Summary' option to input the number of successes (3007) and observations (3363).
- 🔑 Ensure the confidence level is set to 90% before computing the confidence interval.
- 📈 The results from StatCrunch will provide upper and lower limits for the confidence interval, which need to be converted from decimal to percentage form.
- 📌 The confidence interval for the percentage of adults using medication is between 88.5% and 90.3%.
- ❓ The sample of adults aged 57 through 85 years is not representative of college students, so the results cannot be applied to that population.
- 🚫 Since the sample is not characteristic of college students, it tells us nothing about the proportion of college students using prescription medication.
- 📝 The best answer option reflecting the non-applicability of the sample to college students is Answer Option A, 'The results tell us nothing.'
Q & A
What is the main topic of the video?
-The video is about learning how to find a sample proportion and the corresponding confidence interval in a statistics homework problem.
What is the age range of the adults surveyed in the problem statement?
-The adults surveyed are aged between 57 and 85 years.
How many adults in the survey were found to use at least one prescription medication?
-3007 adults were found to use at least one prescription medication.
What is the process to convert a percentage to a decimal for calculation purposes?
-To convert a percentage to a decimal, you move the decimal point two places to the left.
What software does Professor Curtis use to construct a 90% confidence interval estimate?
-Professor Curtis uses StatCrunch to construct the 90% confidence interval estimate.
What is the confidence level used in constructing the confidence interval in the video?
-The confidence level used is 90%.
What is the upper and lower limit of the 90% confidence interval for the percentage of adults using at least one prescription medication?
-The upper limit is 90.3% and the lower limit is 88.5%.
Why can't the results of the survey be applied to college students?
-The sample of adults aged 57 through 85 years is not representative of the college student population, as very few college students would be in that age range.
What does Professor Curtis suggest is the best answer option regarding the results' applicability to college students?
-The best answer option is that the results tell us nothing about the proportion of college students who use at least one prescription medication.
What is the importance of a sample being representative and characteristic of the population in statistics?
-A representative and characteristic sample is crucial for making accurate conclusions about the population from the sample data.
How does Professor Curtis suggest improving one's understanding of statistics if their teacher is not helpful?
-Professor Curtis suggests visiting aspiremountainacademy.com to access lecture videos and other resources for learning statistics.
What is the final advice given by Professor Curtis to the viewers of the video?
-Professor Curtis encourages viewers to leave comments on how well the job was done or how it could be improved, and to visit Aspire Mountain Academy for more help with statistics.
Outlines
📚 Calculating Sample Proportion and Confidence Interval
Professor Curtis introduces the topic of finding a sample proportion and its corresponding confidence interval. He presents a problem statement involving a survey of 3363 adults aged 57 to 85, where 89.4% use at least one prescription medication. For Part A, he demonstrates how to calculate the number of subjects using prescription medication by converting the given percentage to a decimal and multiplying it by the total number of subjects, rounding to the nearest whole number to get 3007. Part B involves constructing a 90% confidence interval estimate for the percentage of adults using medication, which he accomplishes using the StatCrunch software. He inputs the number of successes (3007), the total number of observations (3363), and selects a 90% confidence level to compute the interval, which results in 88.5% and 90.3%. Finally, Part C discusses the applicability of the results to college students, noting that the sample is not representative of college students and thus the results cannot be generalized to that population. The professor concludes that the results tell us nothing about the proportion of college students using prescription medication.
👴 Non-Representative Sample for College Students
The second paragraph addresses the question of how the survey results of adults aged 57 through 85 years can inform us about the proportion of college students using prescription medication. Professor Curtis points out that while there may be a few older individuals attending college for personal enrichment, the sample size of college students within the survey group is likely to be very small and not representative. He emphasizes that for a sample to be useful in making conclusions about a population, it must be representative and characteristic of that population. Since the sample in question does not meet this criterion, the conclusions drawn from it cannot be applied to the population of college students. The professor suggests that the best answer to the question is that the results provide no information about college students' medication use, selecting Answer Option A, 'The results tell us nothing.' He encourages feedback and comments, and promotes Aspire Mountain Academy for more learning resources.
Mindmap
Keywords
💡Sample Proportion
💡Confidence Interval
💡Prescription Medication
💡Survey
💡Statistical Software (StatCrunch)
💡Proportion
💡Rounding
💡Representativeness
💡Population
💡Sample
💡Conversion from Decimal to Percent
💡Non-Representative Sample
Highlights
Professor Curtis introduces a lesson on finding a sample proportion and the corresponding confidence interval.
A problem statement is presented involving a survey of 3363 adults aged 57 through 85 years about prescription medication use.
Part A of the problem is to determine how many subjects used at least one prescription medication, using a calculator and converting percentages to decimals.
The total number of adults using medication is calculated to be 3007, rounded to the nearest integer.
Part B involves constructing a 90% confidence interval estimate for the percentage of adults using medication.
StatCrunch software is used to accomplish the task of constructing the confidence interval.
The number of successes (3007) and observations (total sample size) are inputted into StatCrunch for the calculation.
The confidence level is set to 90%, and the Compute button is pressed to obtain the confidence interval limits.
The resulting confidence interval is 88.5% to 90.3%, after converting decimal numbers to percentages.
Part C discusses the applicability of the results to a different population, specifically college students.
The sample of adults aged 57 through 85 is not representative of college students, limiting the relevance of the findings for that demographic.
The conclusion is that the results do not provide information about the proportion of college students using prescription medication.
Answer Option A, 'The results tell us nothing,' is identified as the best match for the conclusion regarding college students.
The importance of a representative sample for making conclusions about a population is emphasized.
Aspire Mountain Academy is promoted as a resource for engaging lecture videos and statistics homework help.
Professor Curtis encourages feedback and comments from viewers to improve the educational content.
The video concludes with an invitation to visit aspiremountainacademy.com for more information and resources.
Transcripts
Browse More Related Video
Finding the best point estimate and confidence interval for proportions
Finding the sample size needed to estimate a confidence interval on a population mean

Finding a confidence interval given summary sample data
Finding and interpreting a confidence interval for a population mean (σ unknown)

Confidence Interval for a population proportion | Solved Problems
Finding degrees of freedom, critical values, and a standard deviation confidence interval estimate
5.0 / 5 (0 votes)
Thanks for rating: