Introduction to the Difference Quotient
TLDRThis video script introduces the concept of the difference quotient, which is closely related to the average rate of change. The average rate of change is calculated by taking two points on a graph, finding the difference in their function values, and dividing by the difference in their x-values. The difference quotient is a variation of this formula that allows for the calculation of the average rate of change when the second point is not known, but a small distance 'h' between two points is given. The formula for the difference quotient is f(a + h) - f(a) / h, where 'a' is the known point and 'h' is the small distance. The script illustrates the process using a function f(x) = x^2 + 1, showing how the difference quotient can be used to find the average rate of change over an interval and the slope of the secant line between two points. By adjusting the value of 'h', the script demonstrates how the difference quotient can provide a more precise estimate of the slope as 'h' becomes smaller.
Takeaways
- 📈 The concept of the difference quotient is introduced as a method to find the average rate of change between two points on a graph.
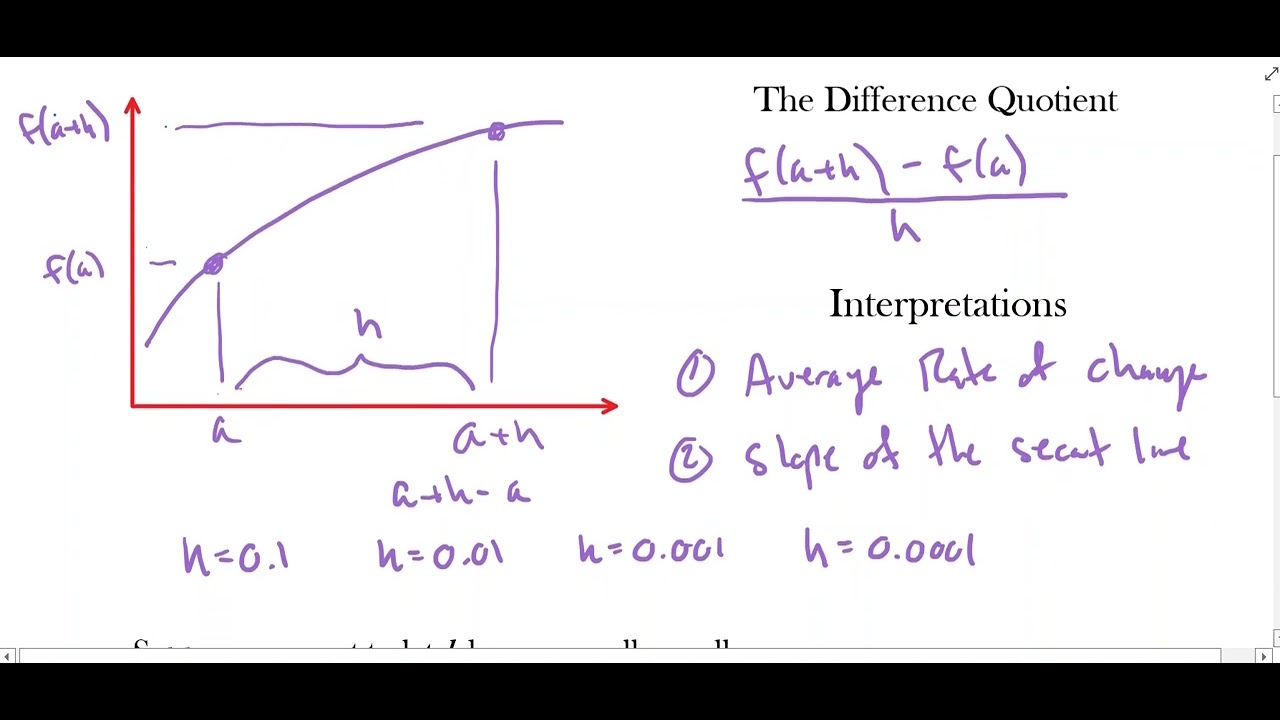
- 🔢 The formula for the difference quotient is (f(a + h) - f(a)) / h, which is a variation of the average rate of change formula.
- ↔️ The difference quotient calculates the rate of change using a small distance h instead of a fixed second point.
- 📉 The 'a's in the formula cancel out, simplifying to (f(a + h) - f(a)) / h, which is the key formula for the difference quotient.
- 📚 The difference quotient is used to find the slope of the secant line between two points on a graph.
- 📐 By drawing a secant line, the difference quotient provides its slope, similar to how the average rate of change formula does.
- 📈 An example is given using the function f(x) = x^2 + 1 to demonstrate how to apply the difference quotient.
- 🔧 The example shows how changing the value of h (e.g., from 0.01 to 0.001) affects the calculation of the average rate of change.
- 📉 As h becomes smaller, the average rate of change approaches the instantaneous rate of change at a point.
- 💡 The difference quotient is a precursor to the derivative, providing insight into how the rate of change varies as the interval between points decreases.
- ➗ The calculation involves evaluating the function at a + h and a, then dividing the difference by h, as shown in the example with h = 0.01 and h = 0.001.
Q & A
What is the main topic of the video?
-The main topic of the video is the introduction of the concept of the difference quotient and its relation to the average rate of change.
What is the formula for average rate of change?
-The formula for average rate of change is (f(b) - f(a)) / (b - a), where f(b) and f(a) are the function values at points b and a, respectively.
How does the difference quotient formula differ from the average rate of change formula?
-The difference quotient formula is f(a + h) - f(a) / h, where h is a small distance instead of a specific second point like b in the average rate of change formula.
What is the significance of the difference quotient?
-The difference quotient is significant because it provides a way to find the average rate of change when the second point is not known, and it gives the slope of the secant line between two points.
How does the value of h affect the difference quotient?
-The value of h, which represents a small distance, affects the difference quotient by making it more precise as h gets smaller. A smaller h value results in a more accurate approximation of the instantaneous rate of change.
What is the purpose of using a small value for h in the difference quotient?
-Using a small value for h allows for a more accurate representation of the rate of change over an infinitesimally small interval, which can approximate the instantaneous rate of change as h approaches zero.
How does the difference quotient relate to the secant line?
-The difference quotient gives the slope of the secant line between two points on a graph, which is the same as the average rate of change over that interval.
What is the example function used in the video to illustrate the difference quotient?
-The example function used in the video is f(x) = x^2 + 1.
What are the interval points used in the example to calculate the difference quotient?
-The interval points used in the example are 2 and 2.01, with h being 0.01.
What is the average rate of change over the interval from 2 to 2.01 according to the example?
-The average rate of change over the interval from 2 to 2.01 is 4.01, which is also the slope of the secant line over that interval.
How does changing the value of h in the example affect the average rate of change?
-When the value of h is changed to a smaller value (e.g., 0.001), the average rate of change over the interval from 2 to 2.001 becomes 4.001, which is a more precise approximation due to the smaller interval size.
What tool or website can be used to calculate the values in the difference quotient example?
-Desmos is a tool or website that can be used to calculate the values in the difference quotient example and verify the results.
Outlines
📐 Introduction to Difference Quotient and Average Rate of Change
This paragraph introduces the concept of the difference quotient and its relation to the average rate of change. The speaker explains that instead of using two known points on a graph, the difference quotient involves a small, unknown distance 'h' from a known point 'a'. The formula for the difference quotient is presented as f(a+h) - f(a) / h, which simplifies to the function value at 'a' plus 'h' minus the function value at 'a', all divided by 'h'. This formula is crucial for finding the average rate of change between two points and for determining the slope of the secant line between them. An example is given using the function f(x) = x^2 + 1 over the interval from 2 to 2 plus a small increment 'h'.
🔍 Applying the Difference Quotient Formula with Varying 'h'
The second paragraph demonstrates the application of the difference quotient formula using the function f(x) = x^2 + 1. The interval considered is from 2 to 2.01 with h = 0.01. The speaker calculates the average rate of change over this interval using the difference quotient, resulting in a slope of 4.01 for the secant line. The paragraph then explores what happens when 'h' is reduced to an even smaller value, such as 0.001, leading to a new interval from 2 to 2.001. The calculation is repeated, yielding an average rate of change of 4.001 for the smaller interval. This illustrates the flexibility of the difference quotient in adjusting to different values of 'h' and its utility in approximating the instantaneous rate of change as 'h' approaches zero.
Mindmap
Keywords
💡Difference Quotient
💡Average Rate of Change
💡Function Value
💡Secant Line
💡Slope
💡Graph
💡Interval
💡Desmos
💡H (small increment)
💡Derivative
💡Limit
Highlights
Introduces the concept of the difference quotient and its relation to the average rate of change formula
Explains how to find the average rate of change using two points on a graph
Introduces a new variable 'h' to represent the unknown distance between two points
Derives the formula for the difference quotient as f(a+h) - f(a) / h
Points out that the difference quotient is a special case of the average rate of change formula
Highlights that the difference quotient is used to find the average rate of change when the second point is unknown
Mentions that h is typically a small value like 0.1, 0.01, 0.001, etc.
Explains that the difference quotient gives the slope of the secant line between two points
Provides an example using the function f(x) = x^2 + 1 and interval [2, 2+h]
Demonstrates calculating the difference quotient for h = 0.01 and h = 0.001
Shows that the average rate of change and slope of the secant line can be found using the difference quotient
Illustrates how changing the value of h affects the difference quotient and average rate of change
Uses Desmos to calculate and verify the difference quotient for different values of h
Points out that the difference quotient becomes the derivative as h approaches 0
Summarizes the key takeaways and practical applications of the difference quotient
Provides a clear, step-by-step explanation of the difference quotient concept
Uses a specific function and interval to make the concept more tangible and easier to understand
Demonstrates the calculation process for the difference quotient in a straightforward manner
Transcripts


5.0 / 5 (0 votes)
Thanks for rating: