Graphing using derivatives | Derivative applications | Differential Calculus | Khan Academy
TLDRThe video script discusses the process of graphing a function without a calculator by utilizing calculus concepts. The focus is on identifying critical points, maximum and minimum points, and inflection points. The function f(x) = 3x^4 - 4x^3 + 2 is differentiated to find critical points and the second derivative is used to determine concavity and inflection points. The video concludes with a rough sketch of the function, demonstrating how calculus can provide insights into the shape of a graph.
Takeaways
- 📈 The script discusses the process of graphing a function without a calculator by using calculus concepts.
- 🔍 The focus is on identifying critical points, maximum and minimum points, and inflection points of a function.
- 💡 The function in question is f(x) = 3x^4 - 4x^3 + 2, and its graphing is done through analysis rather than plotting points.
- 🤔 The first step in graphing is to find the derivative of the function, f'(x) = 12x^3 - 12x^2, to locate critical points.
- 📌 Critical points are found by setting the first derivative equal to zero, resulting in x = 0 and x = 1.
- 🔄 To understand the graph's shape, the second derivative, f''(x) = 36x^2 - 24x, is calculated and analyzed.
- 📈 The second derivative test reveals that at x = 0 and x = 1, the graph is neither concave up nor down, indicating potential inflection points.
- 🔄 Further analysis of the second derivative shows that at x = 2/3, the graph transitions from concave down to concave up, confirming an inflection point.
- 📈 The function's graph is characterized by a minimum point at (1, 1), an inflection point at (0, 2), and another inflection point at (2/3, f(2/3)).
- 🎨 The final graph is a combination of a flat line at x = 0, a downward curve from x < 0 to x = 2/3, and an upward curve from x > 2/3.
Q & A
What is the main goal of the video script?
-The main goal of the video script is to demonstrate how to graph a function without using a graphing calculator, by utilizing knowledge of calculus, specifically differentiation, concavity, maximum and minimum points, and inflection points.
What does the term 'critical points' refer to in the context of this script?
-In this context, 'critical points' refer to the points where the derivative of the function is either zero or undefined. These points are of interest when analyzing the function as they may represent maximum or minimum points, or inflection points.
How is the derivative of the function f(x) = 3x^4 - 4x^3 + 2 found?
-The derivative of the function f(x) = 3x^4 - 4x^3 + 2 is found by applying the power rule of differentiation. The derivative, f'(x), is 12x^3 - 12x^2.
What are the critical points for the function f(x) = 3x^4 - 4x^3 + 2?
-The critical points for the function are x = 0 and x = 1, which are found by setting the first derivative, f'(x), equal to zero and solving for x.
How is the second derivative of the function f(x) = 3x^4 - 4x^3 + 2 calculated?
-The second derivative is calculated by differentiating the first derivative, f'(x) = 12x^3 - 12x^2. The second derivative, f''(x), is 36x^2 - 24x.
What does the second derivative tell us about the function at the critical point x = 0?
-At the critical point x = 0, the second derivative, f''(x), is equal to 0. This indicates that there is neither concavity upwards nor downwards at this point, suggesting it could be a transition point or an inflection point.
How is the inflection point x = 2/3 determined in the script?
-The inflection point x = 2/3 is determined by finding when the second derivative, f''(x), equals zero and then checking the sign of the second derivative on either side of x = 2/3. A change in sign indicates an inflection point.
What is the role of concavity in determining the nature of the critical points in the function?
-The concavity, as indicated by the second derivative, helps determine whether a critical point is a minimum, maximum, or inflection point. If the second derivative is positive (concave upwards), it suggests a minimum point, while if it's negative (concave downwards), it suggests a maximum point. A change in concavity at a point indicates an inflection point.
How does the script suggest the graph of the function changes between x = 0 and x = 1?
-The script suggests that between x = 0 and x = 1, the graph is initially concave downwards (since the second derivative at x = 0 is negative), but as it approaches x = 1 (which is a critical point and concave upwards), the graph transitions to being concave upwards, indicating a change in slope and curvature.
What are the coordinates of the minimum point found in the script?
-The minimum point found in the script occurs at x = 1. The corresponding y-coordinate is found by substituting x = 1 into the original function, which gives f(1) = 3(1)^4 - 4(1)^3 + 2 = 1. Thus, the coordinates of the minimum point are (1, 1).
How does the script conclude the process of graphing the function?
-The script concludes by sketching a rough graph of the function based on the calculated critical points, inflection points, and the intervals of concavity. It emphasizes that the process involves understanding the behavior of the function in different intervals and using this information to draw a graph that reflects the function's characteristics.
Outlines
📈 Introduction to Graphing Functions Using Calculus
The paragraph introduces the concept of graphing a function without a calculator by utilizing knowledge from calculus, specifically focusing on differentiation, concavity, maximum and minimum points, and inflection points. The function f(x) = 3x^4 - 4x^3 + 2 is chosen for this purpose. The speaker emphasizes the importance of identifying critical points, defined as points where the derivative of the function is either zero or undefined. The derivative of the given function is calculated, and the process of finding critical points is started by setting the derivative equal to zero and solving for x.
🔍 Analyzing Critical Points and Concavity
This paragraph delves into the analysis of the critical points and the concavity of the function. The second derivative is calculated to determine the concavity at the critical points and to identify potential inflection points. The speaker solves the second derivative at the critical points and finds that the function is neither concave up nor down at x=0, suggesting a possible transition point or inflection point. However, at x=1, the second derivative is positive, indicating the function is concave up and likely has a minimum point. The speaker also explores the possibility of another inflection point when the second derivative equals zero at x=2/3 and analyzes the sign of the second derivative around this point.
📊 Determining Inflection and Minimum Points
The speaker continues the analysis by confirming the inflection point at x=2/3 and determining the nature of the points x=0 and x=1. It is concluded that x=0 is an inflection point where the function transitions from concave up to concave down. The point x=1 is identified as a minimum point due to the function being concave up at this point. The speaker then calculates the function values at these points, with f(1) = 1 and f(0) = 2, and starts to build the graph with these points and the identified concavity changes.
🖌️ Constructing the Graph of the Function
In this paragraph, the speaker synthesizes the information gathered from the previous analysis to construct the graph of the function. The graph is divided into intervals based on the critical points and inflection points, and the concavity of the function within each interval is used to draw the curve. The speaker describes the graph as starting with a flat section at x=0, going down to an inflection point at x=2/3, then up to a minimum at x=1, and finally continuing the curve upwards. The process of graphing the function using calculus techniques without a calculator is completed, and a visual representation is provided for the viewer.
🎓 Conclusion and Reflection on the Graphing Process
The speaker concludes the video by reflecting on the process of graphing the function using calculus. The emphasis is on the successful application of calculus concepts, such as critical points, inflection points, and concavity, to sketch the graph of a complex function without the aid of a calculator. The viewer is left with an understanding of the power of calculus in visualizing and analyzing functions, and the satisfaction of overcoming the challenge of graphing a 'hairy-looking' function.
Mindmap
Keywords
💡Differentiation
💡Critical Points
💡Concativity
💡Maximum and Minimum Points
💡Inflection Points
💡Derivative Toolkit
💡Graphing Calculator
💡Slope
💡Exponent
💡Constant
💡Transition Point
Highlights
The process of graphing a function without a graphing calculator using calculus concepts is discussed.
The importance of understanding critical points, maximum and minimum points, and inflection points in graphing functions is emphasized.
The function f(x) = 3x^4 - 4x^3 + 2 is used as an example to demonstrate the graphing process.
The derivative of the function is calculated to find the critical points where f'(x) = 0.
The critical points are found to be x = 0 and x = 1, where the derivative is equal to zero.
The second derivative is calculated to determine the concavity and inflection points of the function.
At x = 0, the function is neither concave up nor down, indicating a potential inflection point.
At x = 1, the second derivative is positive, indicating a minimum point and concave up.
Another potential inflection point is identified at x = 2/3, where the second derivative changes from zero.
The second derivative is positive below x = 2/3 and negative above it, confirming it as an inflection point.
The function is graphed with the identified critical points, inflection points, and knowledge of concavity.
The point (0, 2) is identified as an inflection point with a slope of 0 and concave up below and down above this point.
The point (1, 1) is identified as a minimum point with a slope of 0 and concave up.
The function is graphed with a transition from concave down to concave up at x = 2/3.
The process demonstrates the application of calculus in understanding and graphing functions without the use of technology.
The video concludes with a rough sketch of the graph based on the calculated points and concavity analysis.
Transcripts
Browse More Related Video
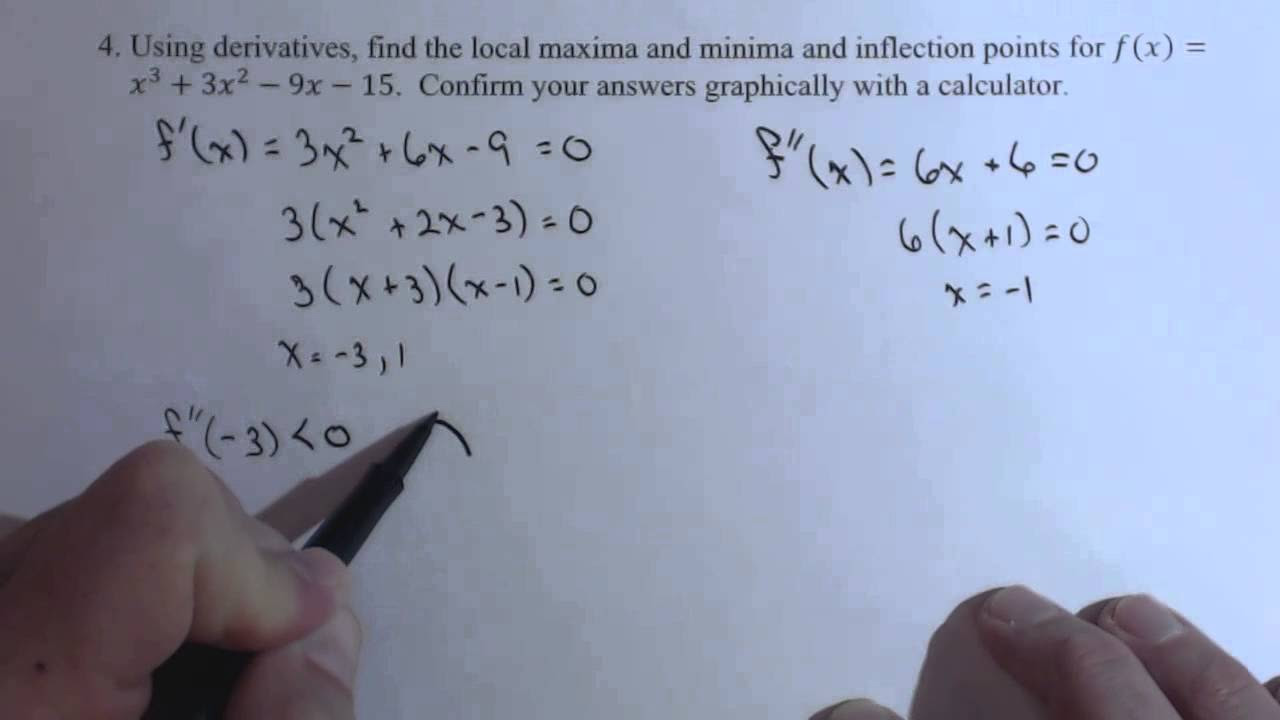
Fiding Relative Max, Min and Inflection Point with Derivatives F4
Graphing a Polynomial Equation :: Curve Sketching Using Calculus
Increasing/Decreasing, Concave Up/Down, Inflection Points
Absolute Maximum and Minimum Values - Finding absolute MAX & MIN of Functions - Calculus
Relative Maxima/Minima Examples
Maxima , minima and point of inflection
5.0 / 5 (0 votes)
Thanks for rating: