Business Calculus - Math 1329 - Section 3.1 - Increasing and Decreasing Functions; Relative Extrema
TLDRThis educational video delves into the concepts of increasing and decreasing functions within mathematical analysis, using detailed examples and graphs to illustrate the principles. It explains how to determine the behavior of functions based on derivatives and critical values, emphasizing the importance of sign charts and the conditions under which functions change their increasing or decreasing status. The video also explores relative extrema, discussing how to identify maximum and minimum points on a graph through critical values and derivative tests. It's a comprehensive guide for understanding and applying these fundamental concepts in calculus.
Takeaways
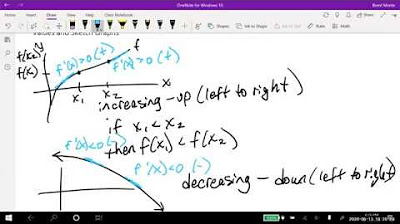
- 📈 A function is considered increasing on an interval if for any two numbers x1 and x2 within the interval, where x1 < x2, f(x1) < f(x2).
- 📉 Conversely, a function is decreasing on an interval if for any two numbers x1 and x2 within the interval, f(x1) > f(x2) when x1 < x2.
- 🔍 To determine where a function is increasing or decreasing, one must look at the x-values and the relationship between the function values at those points.
- 🤔 The concept of increasing and decreasing is relative to the interval considered and does not require knowledge of the y-values.
- 🏞️ Functions can have multiple intervals of increase or decrease, and these intervals can be combined using the union operation.
- 🔺 A function can change from increasing to decreasing or vice versa at points where there is a horizontal tangent line or where the derivative is undefined.
- 🧮 The derivative of a function (f'(x)) is used to find critical values, which are potential points of increase or decrease.
- 📊 A sign chart is a tool for determining the intervals of increase and decrease by testing the sign of the derivative within each interval created by critical values and partition points.
- ↗️ If the derivative f'(x) is positive, the function f(x) is increasing; if f'(x) is negative, the function is decreasing.
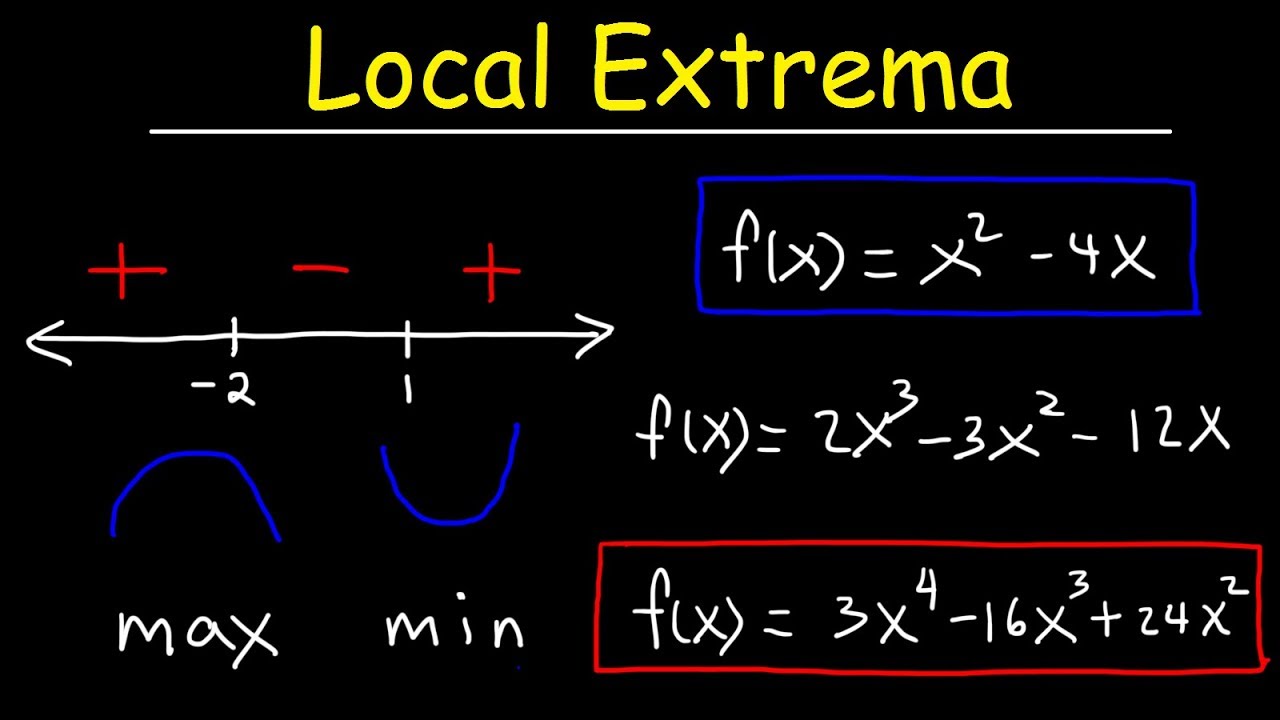
- 🔍 To find relative extrema (maxima or minima), one must evaluate the function at critical values where the derivative is zero or undefined.
- 📋 Relative extrema are local phenomena and can only occur at critical values; they are the highest or lowest points in a given interval.
Q & A
What is the criterion for a function to be considered increasing on an interval?
-A function is considered increasing on an interval if for any two numbers x1 and x2 within the interval, where x1 is less than x2, f(x1) is less than f(x2).
How can you identify if a function is decreasing on a given interval?
-A function is decreasing on an interval if for any two numbers x1 and x2 within the interval, where x1 is less than x2, f(x1) is greater than f(x2).
What is a critical value in the context of calculus?
-A critical value, often denoted as 'c', is a value in the domain of a function 'f' that makes the derivative f'(c) equal to zero or undefined.
What is the significance of a horizontal tangent line in determining the behavior of a function?
-A horizontal tangent line indicates a point where the function's rate of change is zero, which can be a point where the function changes from increasing to decreasing or vice versa.
How do you determine the intervals where a function is increasing or decreasing?
-To determine these intervals, first find all critical values, then find partition points, create a sign chart by testing points in each interval created by the partition points, and finally, use the sign of the derivative to conclude where the function is increasing (positive derivative) or decreasing (negative derivative).
What is a relative extremum?
-A relative extremum is a point on the graph of a function where the function has a local maximum or minimum. It is also known as a local extremum.
Why is it important to consider the domain of the original function when finding critical values?
-It is important because critical values must be within the domain of the original function to be considered valid. Points where the function is undefined, such as division by zero, are not valid critical values.
How does the sign of the derivative at a point relate to the function's behavior at that point?
-If the derivative is positive at a point, the function is increasing there. If the derivative is negative, the function is decreasing. A zero or undefined derivative indicates a potential change in the function's behavior.
What is the quotient rule used for in calculus?
-The quotient rule is used to find the derivative of a function that is the quotient of two other functions, that is, when the function is in the form of one function divided by another.
What is the role of a sign chart in analyzing the behavior of a function?
-A sign chart is a tool used to visualize and analyze the intervals where the derivative of a function is positive, negative, or zero. It helps in determining where the function is increasing, decreasing, or has a constant rate of change.
How does the concept of a relative extremum relate to the critical points of a function?
-Relative extrema occur at critical points of a function. These are the points where the derivative is zero or undefined. A relative maximum or minimum is a local maximum or minimum that occurs at these critical points.
Outlines
📈 Understanding Increasing and Decreasing Functions
This paragraph introduces the concepts of increasing and decreasing functions, as well as relative extrema. It explains how to determine if a function is increasing or decreasing by comparing the values of the function at two points within a given interval. The paragraph also describes how to identify intervals of increase and decrease by examining the function's graph and behavior, such as the presence of horizontal or vertical tangent lines. Additionally, it touches on the importance of considering the x-values when discussing the monotonicity of a function.
📊 Analyzing Graphs and Critical Values
This section delves deeper into the analysis of function graphs to identify intervals of increase and decrease. It emphasizes the need to look for changes in the function's behavior, such as transitions from increasing to decreasing or vice versa. The concept of critical values is introduced, explaining that they are points where the derivative is zero or undefined. The paragraph outlines the process of finding critical values by setting the derivative equal to zero and solving for x. It also discusses how to use these critical values to determine the intervals where a function is increasing or decreasing.
🧠 Sign Chart and Derivative Analysis
The paragraph explains the use of a sign chart as a tool for determining where a function is increasing or decreasing. It outlines the steps for creating a sign chart, which involves finding critical values, partition points, and testing intervals for sign consistency. The paragraph also clarifies the relationship between the sign of the derivative and the function's monotonicity: a positive derivative indicates an increasing function, while a negative derivative indicates a decreasing function. The explanation includes an example of how to apply this process to a specific function.
🔍 Example: Finding Intervals of Increase and Decrease
This paragraph presents a worked example of finding the intervals where a given polynomial function is increasing and decreasing. It demonstrates the process of taking the derivative of the function, solving for critical values, and creating a sign chart to determine the intervals. The example illustrates how to factor the derivative, solve for x when the derivative is zero, and how to interpret the sign chart to identify the function's behavior across different intervals.
📉 Discontinuities and Relative Extrema
The focus of this paragraph is on the impact of discontinuities on the analysis of increasing and decreasing intervals. It explains that discontinuities, such as vertical asymptotes, can act as partition points where the function's behavior changes. The paragraph also introduces the concept of relative extrema, which are local maxima or minima that occur at critical values. It emphasizes that relative extrema can occur at points where the derivative is zero or undefined, and provides a visual explanation of how to identify these points on a graph.
📈 Identifying Relative Extrema
This section discusses the process of identifying relative extrema for a given function. It explains that relative extrema occur at critical values and provides a method for finding these points by setting the derivative equal to zero and solving for x. The paragraph also includes an example of a function and demonstrates how to sketch its graph, including the relative maxima and minima, using the derivative and sign chart analysis.
🤔 Complex Critical Values and Sign Chart Testing
This paragraph explores more complex scenarios where the derivative is undefined, leading to vertical tangent lines and critical values that are not part of the function's domain. It explains how to handle these situations in the sign chart and how they affect the intervals of increase and decrease. The paragraph also includes a detailed example of a function with a complex derivative, illustrating the process of finding critical values, creating a sign chart, and determining the intervals of increase and decrease.
🎨 Graphing Functions with Extrema
The final paragraph of the script focuses on graphing functions with relative extrema, including those with vertical tangent lines. It provides a step-by-step guide on how to plot the function's graph, highlighting the importance of accurately depicting the behavior of the function at critical points. The paragraph concludes with a brief recap of the main concepts discussed in the video script, encouraging viewers to apply these techniques in their own analysis of functions.
Mindmap
Keywords
💡Increasing Function
💡Decreasing Function
💡Relative Extrema
💡Critical Values
💡Derivative
💡Partition Points
💡Sign Chart
💡Horizontal Tangent Line
💡Vertical Asymptote
💡Cusp
💡Product Rule
Highlights
The definition of increasing and decreasing functions based on the comparison of function values at different points within an interval.
The method of identifying the intervals where a function is increasing or decreasing by examining the graph and the behavior of the function.
The concept of critical values and how they are used to determine the intervals of increase and decrease for a function.
The explanation of how to find critical values by setting the derivative of a function equal to zero and identifying where the derivative is undefined.
The process of creating a sign chart to visualize and determine the intervals where a function is increasing or decreasing.
The relationship between the slope of a tangent line and the increase or decrease of a function at a particular point.
The method of using the first derivative to determine where a function has a relative maximum or minimum by identifying horizontal or vertical tangent lines.
The definition of relative extrema and how they relate to the local maxima and minima of a function within a specific interval.
The explanation of how to find the relative extrema of a function by analyzing the critical values and the behavior of the function around these points.
The example of a function transformation that results in a relative maximum and minimum, illustrating the process of identifying these points.
The demonstration of how to sketch a function graph by using the critical values, sign chart, and understanding of increasing and decreasing intervals.
The concept of a function having a reset point, which is a point of discontinuity, and how it affects the increasing and decreasing intervals.
The method of testing specific points within intervals to determine the sign of the derivative and thus the increasing or decreasing nature of the function.
The example of a function with a vertical tangent line, illustrating how this affects the graph and the intervals of increase and decrease.
The comprehensive approach to analyzing a function's behavior, including identifying critical values, creating a sign chart, and sketching the graph to understand the function's global behavior.
Transcripts
Browse More Related Video


5.0 / 5 (0 votes)
Thanks for rating: