Business Calculus - Math 1329 - Sections 5.4 & 5.5 - Applications of the Definite Integral
TLDRThis video script delves into the applications of the definite integral, illustrating how it can be used to measure accumulation of rates, such as distance traveled, accumulated snow, rainfall, or money. The concept is introduced through a simple example of a car traveling at a constant speed, equating the area under the velocity-time graph to the distance covered. The script then explores more complex scenarios, including calculating the area under a curve using calculus for variable rates, and applying these principles to find the net excess profit from different investment opportunities. Additionally, the video explains the Lorenz curve and Gini index as tools for measuring income and wealth distribution, providing a method to quantify economic inequality. The script is educational, offering a clear understanding of calculus in real-world contexts.
Takeaways
- 📐 **Definite Integral Application**: The definite integral is used to calculate the accumulation of a rate, such as distance traveled when given a velocity function over time.
- 🚗 **Constant Speed Calculation**: For an object moving at a constant speed, the distance traveled can be found by multiplying the speed by the time (e.g., 50 miles/hour * 2 hours = 100 miles).
- 📈 **Area Under the Curve**: The area under a velocity curve between two points represents the total distance traveled during that time interval.
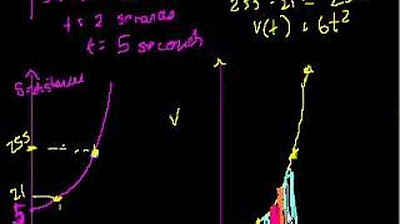
- 🛓 **Integration for Variable Rates**: When the rate is not constant, the definite integral of the rate function over a given interval is used to find the total accumulation, such as distance under a varying speed curve.
- ❄️ **Snow Accumulation Example**: The definite integral is applied to find the total snow accumulation by integrating the rate of snowfall over a period of time.
- 📉 **Area Between Curves**: To find the area between two curves, integrate the top function minus the bottom function over the common interval where the top function is above the bottom function.
- 💰 **Net Excess Profit**: The difference in profit accumulation between two investment opportunities over time can be calculated using definite integrals to find the net excess profit.
- 📊 **Lorenz Curve and Gini Index**: The Lorenz curve is a graphical representation of wealth or income distribution, and the Gini index is a measure of income concentration derived from it.
- 🔢 **Gini Index Calculation**: The Gini index is calculated as twice the integral of the difference between the absolute equality line and the Lorenz curve, divided by the area under the absolute equality line.
- 📉 **Average Value of a Function**: The average value of a continuous function over an interval is found by dividing the integral of the function over that interval by the length of the interval.
- 🔑 **Integration on a Calculator**: When an antiderivative is not easily found, using a calculator to compute the integral, especially for complex functions, is a practical approach.
Q & A
What is the main concept being discussed in the provided transcript?
-The main concept discussed is the application of definite integrals to determine accumulation of quantities such as distance, snowfall, rainfall, and profit over time.
How is the distance traveled by a car calculated when it is moving at a constant speed?
-The distance traveled is calculated by multiplying the constant speed by the time of travel. For example, if a car travels at 50 miles per hour for 2 hours, it covers 100 miles.
What is the significance of the area under a velocity-time graph?
-The area under a velocity-time graph represents the total distance traveled by an object over the time period considered.
How does one find the time when the rate of snowfall is zero, given a function s(t) = t - (1/4)t^2?
-To find the time when the rate of snowfall is zero, set the function s(t) equal to zero and solve for t. The solutions will give the time intervals for which the snowfall rate is zero.
What is the formula for calculating the accumulated snowfall using the definite integral?
-The accumulated snowfall is calculated using the definite integral from the start time to the end time of the snowfall, which is expressed as ∫(s(t))dt from the start time to the end time.
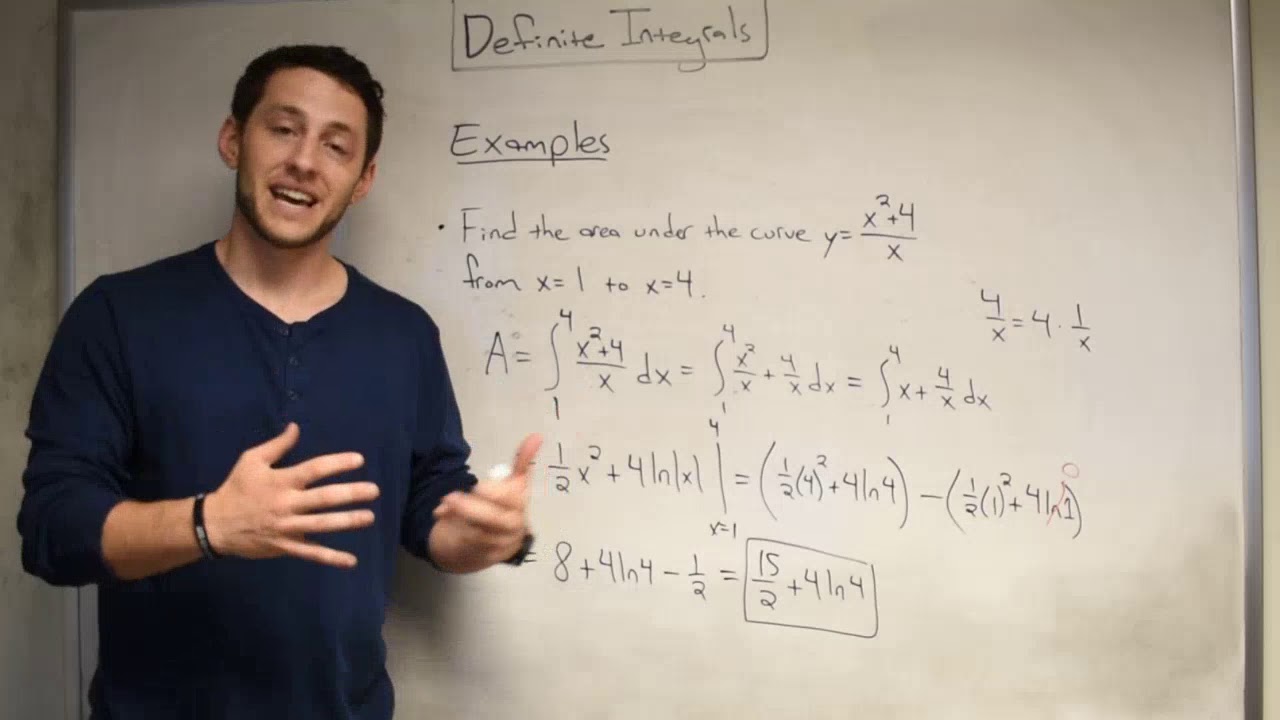
How do you find the area bounded between two curves, such as f(x) = 2x + 1 and g(x) = 4 - x^2?
-To find the area bounded between two curves, first find the points of intersection to determine the limits of integration. Then integrate the top function minus the bottom function over the interval to get the area.
What is the concept of net excess profit in the context of investment opportunities?
-Net excess profit refers to the additional profit gained by choosing an investment with a higher rate of return over another investment with a lower rate of return over a certain period.
How is the Gini index related to the Lorenz curve?
-The Gini index is a measure of income concentration derived from the Lorenz curve. It represents the area between the Lorenz curve and the line of absolute equality, expressed as a ratio relative to the maximum area under the line of absolute equality.
What is the formula for calculating the Gini index?
-The Gini index is calculated as twice the integral from 0 to 1 of (X - L(X))dX, where X is the variable representing the cumulative percentage of total income, and L(X) is the Lorenz curve function.
How is the average value of a continuous function over an interval found?
-The average value of a continuous function over an interval [A, B] is found using the formula (1/(B - A)) * ∫(A to B) f(x)dx.
What is the significance of the Lorenz curve in measuring income distribution?
-The Lorenz curve graphically represents the cumulative percentage of total income received by the bottom x percent of income earners. It is a tool for comparing the degree of inequality in different societies or countries.
Outlines
🚗 Understanding Definite Integrals through Velocity and Distance
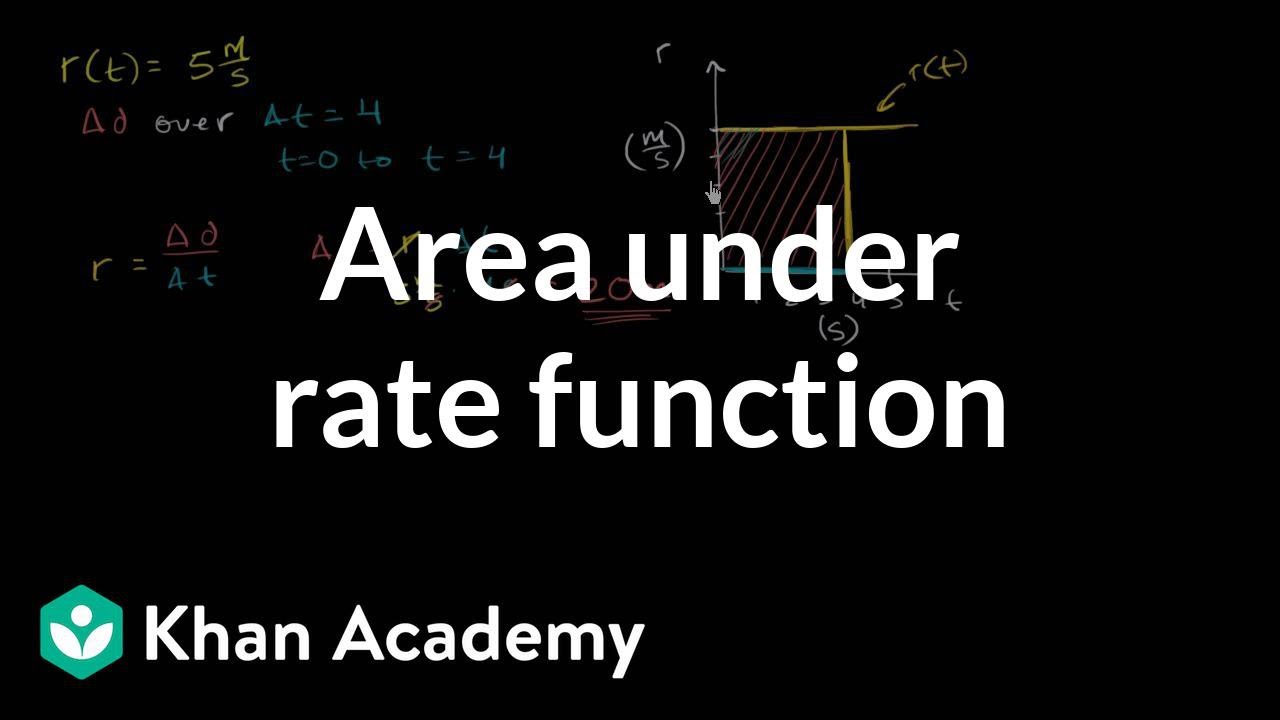
This paragraph introduces the concept of definite integrals by using the example of a car traveling at a constant speed. It explains how the area under the velocity curve (which is a rectangle, given the constant speed) between two points on the time axis can be used to calculate the distance traveled. The key takeaway is that integrals can be used to find accumulations, such as distance, based on rates, such as velocity.
❄️ Calculating Snow Accumulation with Definite Integrals
The second paragraph explores the application of definite integrals in calculating the accumulation of snowfall. It presents a scenario where snowfall rate is given by a function of time and shows how to find the total snow accumulation by integrating this rate function over a specific time interval. The process involves finding the antiderivative of the rate function and evaluating it over the interval from the start to the end of snowfall.
📈 Finding the Area Between Two Curves
This section discusses how to find the area between two curves by setting them equal to each other to find the points of intersection. It emphasizes the importance of integrating the top function minus the bottom function to ensure the integrand is always positive, which corresponds to the actual area. The example provided involves finding the area between a linear function and a downward-facing parabola.
🔢 Solving for Bounds and Computing Separate Integrals
The fourth paragraph deals with finding the area between two curves when the curves switch positions over an interval. It demonstrates how to find the bounds algebraically and then calculate two separate integrals for the regions where each curve is on top. The results of these integrals are then added to find the total area between the curves over the interval.
💰 Net Excess Profit from Investment Opportunities
This paragraph examines the concept of net excess profit when choosing between two investment opportunities with different rates of profit growth. It involves solving an inequality to find the time period where one investment's rate of profit exceeds the other's. Then, it calculates the net excess profit by integrating the difference in profit rates over the determined time period.
📊 Lorenz Curve and Gini Index for Income Distribution
The sixth paragraph introduces the Lorenz curve as a graphical representation of the distribution of income or wealth within a society. It explains the properties of the Lorenz curve and how it can be used to measure income inequality. The paragraph also discusses the Gini index, which is derived from the Lorenz curve and provides a single number as a measure of income concentration.
🧮 Average Value of a Function and its Application
The seventh paragraph explains the concept of the average value of a continuous function over a given interval. It presents the formula for calculating this average value and provides an example of how to apply it to find the average monthly sales of a new toaster model over its first year on the market.
🤝 Intersection of Two Functions and their Bounded Area
The eighth paragraph continues the discussion on finding the area between two curves, specifically focusing on when the curves intersect at certain points. It demonstrates how to set up the integrals to find the area between the curves by considering which function is on top within different intervals and integrating accordingly.
📚 Solving for Investment Profitability and Excess Profit
The ninth paragraph is about determining the period during which one investment's profitability rate exceeds another's. It involves solving an inequality to find the time frame and then calculating the net excess profit by integrating the difference in profit rates over that time frame.
🌐 Lorenz Curve and Gini Index Calculation
The tenth paragraph provides a detailed example of how to calculate the Gini index for a country using the Lorenz curve. It walks through the process of integrating the difference between the Lorenz curve and the line representing absolute equality, and then adjusting for the area under the line of equality.
🔢 Gini Index Calculation for a Given Lorenz Curve Function
The final paragraph offers a specific example of calculating the Gini index, providing the Lorenz curve function and the steps to compute the index. It concludes with the Gini index value for the given example, indicating the level of income inequality.
Mindmap
Keywords
💡Definite Integral
💡Velocity Function
💡Cruise Control
💡Rate of Change
💡Antiderivative
💡Net Excess Profit
💡Lorenz Curve
💡Gini Index
💡Average Value of a Function
💡Riemann Sum
💡Area Under the Curve
Highlights
Applications of the definite integral are discussed, focusing on using area to determine accumulation of a rate, such as distance traveled.
The concept of a velocity function as a constant horizontal line representing constant speed is introduced.
Graphical representation of distance traveled is shown as the area under a curve, like a rectangle for constant speed.
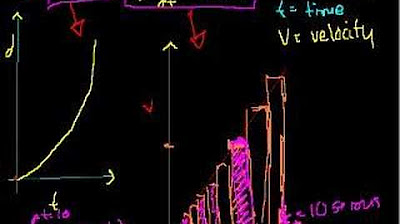
Calculus is used to compute the area under a squiggly curve, which represents varying rates over time.
The definite integral is established as an accumulation function, with examples including snow accumulation and investment profit.
The rate of snowfall is modeled by a function s(t) = t - (1/4)t^2, with the time of no snowfall being solved algebraically.
The area under the snowfall rate curve is calculated using integration to find the total snow accumulated.
An example of finding the area between two curves, f(x) and g(x), is demonstrated to find a bounded region's area.
Integration is used to calculate the net excess profit between two investment opportunities over a given period.
The Lorenz curve is introduced as a graphical representation of the distribution of income or wealth within a society.
The Gini index is explained as a measure of income concentration, derived from the difference between the Lorenz curve and a line of absolute equality.
A formula for calculating the Gini index is provided, emphasizing the use of integration in its computation.
An example calculation of the Gini index for a country with a given Lorenz curve function is demonstrated.
The average value of a function over a closed interval is discussed, with a formula provided for its calculation.
An application of calculating the average monthly sales of a new toaster model using the average value formula is shown.
The concept of the integral for finding the area between curves is revisited with a new example, emphasizing the need for separate integrals when the curves switch positions.
The calculation of the net excess profit is detailed, showing how to find the additional profit from choosing one investment over another.
The use of the definite integral in various real-world applications, such as economics and physics, is highlighted to demonstrate its versatility.
Transcripts


5.0 / 5 (0 votes)
Thanks for rating: