Area under rate function gives the net change | AP Calculus AB | Khan Academy
TLDRThe video script discusses the concept of velocity and rate in physics, using a simple example of an object moving at a constant speed. It explains how velocity, defined as the change in distance over time, can be positive or negative depending on the direction of movement. The script further illustrates how the total change in distance over a given time period can be calculated by multiplying the constant rate by the change in time. It then connects this concept to the area under the rate function graph, demonstrating that this area represents the net change in distance over time. The example provided involves a rate function that changes abruptly after two seconds, showing how to calculate the total distance traveled in such a scenario. The explanation is clear, engaging, and informative, providing a solid understanding of the relationship between rate, time, and distance.
Takeaways
- 📈 Velocity is the rate of change of distance with respect to time, typically measured in meters per second (m/s).
- 🔄 Positive velocity indicates movement to the right, while negative velocity indicates movement to the left.
- 🕒 The change in distance (Δd) over a time interval (Δt) can be calculated by multiplying the constant rate by the change in time.
- 📊 The concept of rate can be visualized as the slope of a line on a graph, representing the change in one quantity relative to another.
- 🤔 The area under the rate function (or velocity-time graph) over a specific time period represents the total change in distance.
- 🌟 In a simple linear scenario, the area under the rate curve directly corresponds to the net change in distance over time.
- 🛤️ For a piecewise rate function, the total change in distance is the sum of the areas under the curve for each segment of the function.
- 📈 In the example given, a rate function that increases from 1 m/s to 2 m/s at 2 seconds demonstrates how the area under the curve can be calculated in parts.
- 🔢 The units of the area under the rate curve are consistent with the units of the axes, resulting in meters when using a rate in meters per second and time in seconds.
- 🧠 Understanding the relationship between rate functions and their corresponding areas under the curve is crucial for grasping concepts in pre-algebra and beyond.
- 🌐 The principles discussed are applicable to various real-world scenarios, such as calculating the total distance traveled by an object moving at varying speeds over time.
Q & A
What does the term 'velocity' refer to in the context of the script?
-In the context of the script, 'velocity' refers to the speed of an object in a specific direction. It is a vector quantity that takes into account both the magnitude (how fast an object is moving) and the direction of the object's motion. A positive velocity indicates movement to the right, while a negative velocity indicates movement to the left.
What is the significance of the delta symbol (∆) in the script?
-The delta symbol (∆) in the script represents change. It is used to denote the difference or alteration in a quantity over time or in response to some other variable. In the context of the script, ∆t represents the change in time, and ∆s represents the change in distance.
How is the rate of change in distance with respect to time calculated?
-The rate of change in distance with respect to time is calculated by dividing the change in distance (∆s) by the change in time (∆t). This gives the average rate of speed over the specified time interval. Mathematically, it is expressed as v = ∆s / ∆t.
What is the relationship between distance, rate, and time in the script's example?
-In the script's example, the relationship between distance, rate, and time is demonstrated by the formula distance = rate × time. Here, a constant rate of five meters per second is multiplied by a change in time of four seconds to yield a change in distance of 20 meters.
How does the area under the rate function on a graph represent the change in distance?
-The area under the rate function on a graph represents the total change in distance over the specified time period. By calculating the area under the curve (which is essentially the product of the change in time and the constant rate), one can determine the net change in distance the object has traveled.
What happens to the units of measurement when calculating the area under the rate function?
-When calculating the area under the rate function, the units of measurement reflect the product of the units on the axes. In the script's example, the rate is given in meters per second (m/s) and time is in seconds (s), so the area is measured in meters (m), which is the product of distance (m) and time (s) units.
How does the script illustrate a change in rate over time?
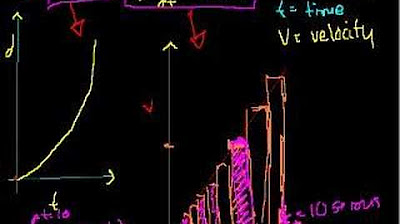
-The script illustrates a change in rate over time by presenting a hypothetical scenario where the rate of speed initially is one meter per second for the first two seconds, and then it jumps to two meters per second for the time thereafter. This is graphed as a step function, with a sudden increase in the rate after two seconds.
What is the total change in distance over the first five seconds in the example with a changing rate?
-In the example with a changing rate, the total change in distance over the first five seconds is calculated by breaking it down into two parts: the first two seconds at a rate of one meter per second, and the next three seconds at a rate of two meters per second. The change in distance for the first two seconds is 2 meters (2s × 1m/s), and for the next three seconds, it is 6 meters (3s × 2m/s). Adding these together gives a total change in distance of 8 meters.
How does the concept of instantaneous speed differ from average speed?
-Instantaneous speed is the speed of an object at a specific moment in time, whereas average speed is the overall rate of motion over a period of time. Instantaneous speed can be thought of as the limit of average speed as the time interval approaches zero. In the script, the speedometer of a car showing the speed at any given moment is an example of instantaneous speed.
What is the significance of the rate function graph in understanding the concept of speed and distance?
-The rate function graph is a visual representation that helps in understanding the relationship between speed, time, and distance. It shows how the rate of speed changes over time and, by calculating the area under the curve, one can determine the total change in distance. This graphical approach provides an intuitive understanding of these concepts and their interrelations.
How does the script relate the concept of rate to pre-algebra and distance?
-The script relates the concept of rate to pre-algebra by revisiting the fundamental formula distance = rate × time, which is a cornerstone in understanding rates. This formula is used to calculate the change in distance given a constant rate and a specific time interval, aligning with the pre-algebraic principles of ratios and proportions.
Outlines
📐 Understanding Velocity and Rate of Change
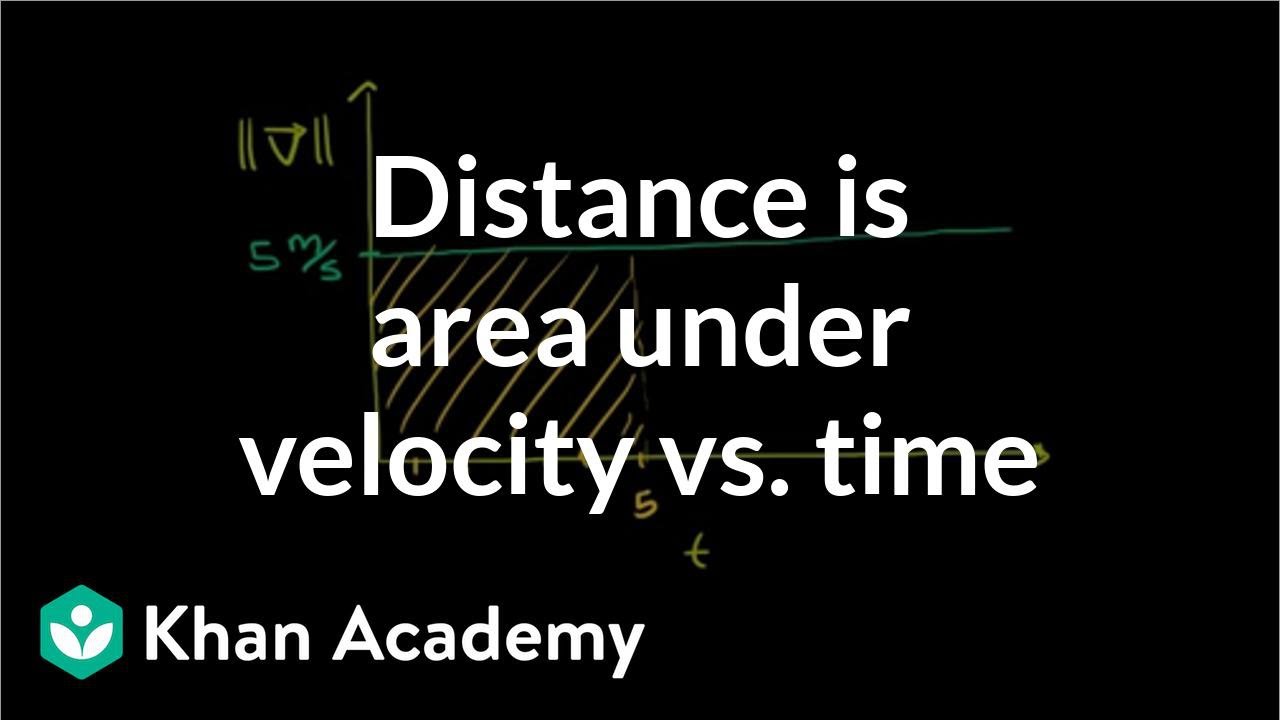
This paragraph introduces the concept of velocity and rate of change in one dimension. It explains that velocity is the constant speed at which an object is moving, with positive values indicating movement to the right and negative values indicating movement to the left. The discussion then transitions to the change in distance over a specific time interval, represented by the delta symbol. The paragraph further clarifies that the rate, by definition, is the change in a quantity over another quantity, in this case, distance over time. It illustrates the concept using a pre-algebra formula where distance equals rate times time. The example provided involves a constant rate of five meters per second over a four-second interval, resulting in a 20-meter change in distance. The paragraph concludes by connecting this concept to the area under the rate function graph, demonstrating that the area represents the total change in distance over the given time period.
📊 Analyzing the Area Under the Rate Function
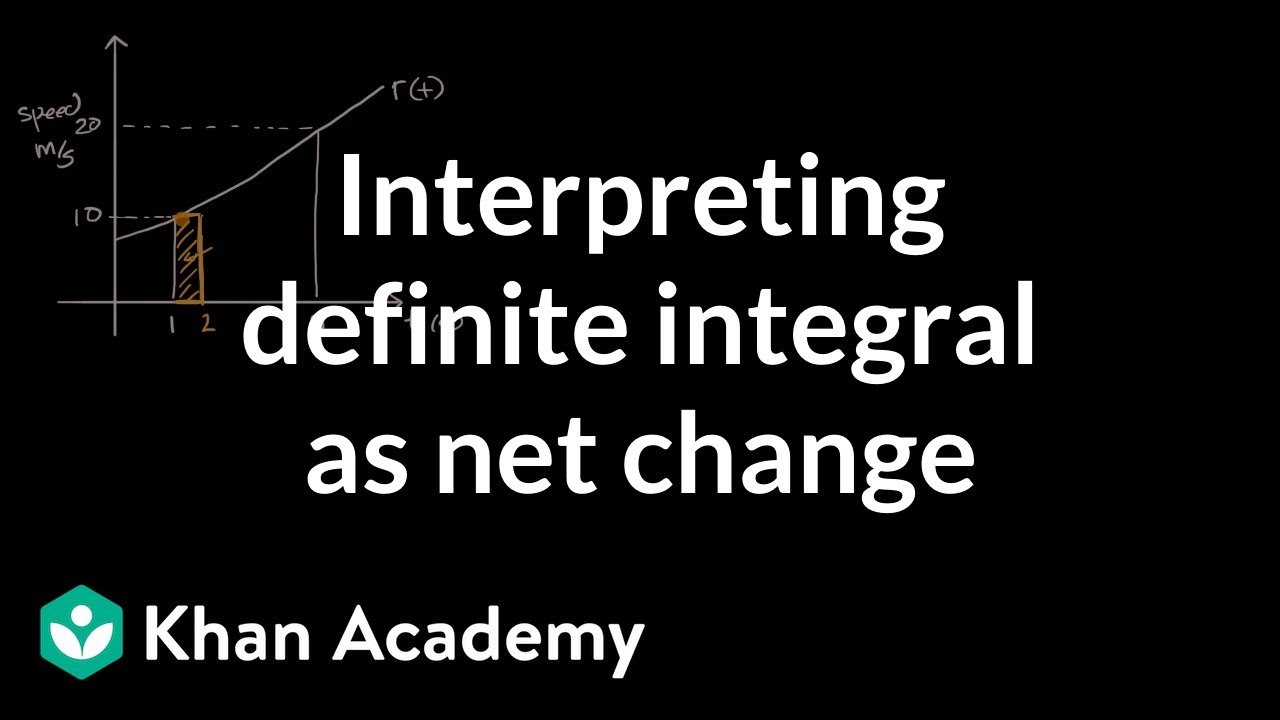
This paragraph delves into the relationship between the rate function and the total change in distance over a specified time interval. It begins by setting up a graph with a rate axis in meters per second and a time axis in seconds. The example given has a piecewise rate function where the rate is one meter per second for the first two seconds and two meters per second for the remaining three seconds of a five-second interval. The paragraph then breaks down the calculation of the total change in distance by considering the two separate time segments. The first segment, lasting two seconds with a rate of one meter per second, results in a two-meter change in distance. The second segment, lasting three seconds with a rate of two meters per second, results in a six-meter change. By summing these changes, the total change in distance over the five seconds is eight meters. The key takeaway is that the area under the rate curve represents the total net change in the quantity being measured, which in this context is the distance traveled over time.
Mindmap
Keywords
💡Velocity
💡Rate
💡Change in Distance
💡Delta (Δ)
💡Area under the curve
💡Rate function
💡Graph
💡Constant rate
💡Units of measurement
💡Total net change
💡Pre-algebra
Highlights
Exploring the concept of velocity and its representation in one dimension, where positive indicates rightward movement and negative indicates leftward movement.
Discussing the delta symbol as a representation of change over time, specifically in the context of distance changing over a four-second interval.
Defining rate as a change in quantity, such as distance over a change in time, and relating it to pre-algebra concepts with the formula distance equals rate times time.
Calculating the change in distance over a four-second interval with a constant rate of five meters per second, resulting in a 20-meter change.
Introducing the concept of the area under the rate function as a representation of the total change in distance over a given time period.
Graphing the rate function with a constant velocity of five meters per second over time, illustrating the relationship between rate and time.
Describing a hypothetical rate function with a sudden change in velocity from one meter per second to two meters per second after two seconds.
Explaining the process of calculating the total change in distance over a five-second interval with a piecewise constant rate function.
Breaking down the calculation into two parts for the piecewise rate function: the first two seconds at one meter per second and the following three seconds at two meters per second.
Summing up the areas under the rate function for each time interval to find the total net change in distance, resulting in an eight-meter change over five seconds.
Reinforcing the idea that the area under the rate curve represents the total net change in the quantity being measured, in this case, distance per unit time.
Providing an intuitive understanding of how the area under the rate function can be used to determine the net change in distance for a variable rate over time.
Using the principles of rate and distance to analyze and solve problems involving constant and variable velocities.
Demonstrating the application of basic algebraic concepts to real-world physical problems, such as calculating distances and velocities.
Highlighting the importance of understanding the relationship between rate, distance, and time in problem-solving, especially in the fields of physics and engineering.
Exploring the mathematical representation of physical phenomena through the use of graphs and functions, emphasizing the visual aspect of problem-solving.
Encouraging further exploration of rate functions and their applications in various scientific and technical domains.
Transcripts
Browse More Related Video
Interpreting definite integral as net change | AP Calculus AB | Khan Academy
Why distance is area under velocity-time line | Physics | Khan Academy
AP Physics Workbook 1.F Constant Velocity
AP Physics 1 review of 1D motion
Definite integrals (part II)
2011 Calculus AB Free Response #1 parts b c d | AP Calculus AB | Khan Academy
5.0 / 5 (0 votes)
Thanks for rating: