Machine Learning Fundamentals: Sensitivity and Specificity
TLDRIn this StatQuest video, Josh explains the concepts of sensitivity and specificity in the context of machine learning, using the example of predicting heart disease. Sensitivity measures the percentage of actual positives that were identified correctly, while specificity measures the percentage of actual negatives that were identified correctly. The video demonstrates how to calculate these metrics for both binary classification (using a confusion matrix with two categories) and multi-class classification (with a more complex confusion matrix). The discussion includes comparing logistic regression and random forest models, emphasizing the trade-off between identifying true positives and true negatives based on the importance of each in a given scenario.
Takeaways
- 📊 Sensitivity and specificity are key metrics in machine learning used to evaluate the performance of classification models.
- 🧠 The script continues a series on machine learning fundamentals, focusing on explaining sensitivity and specificity clearly.
- 🏥 The example used in the first half of the video involves a binary classification problem: predicting the presence or absence of heart disease.
- 🔢 Sensitivity is calculated as True Positives / (True Positives + False Negatives), representing the percentage of actual positives correctly identified.
- 🔢 Specificity is calculated as True Negatives / (True Negatives + False Positives), representing the percentage of actual negatives correctly identified.
- 📈 In the second half, the video explains how to calculate sensitivity and specificity for multi-class classification problems with a confusion matrix of three or more rows and columns.
- 🌳 The script provides an example using a random forest model and logistic regression, comparing their sensitivity and specificity values.
- 🔎 The video emphasizes the importance of choosing the right model based on whether correctly identifying positives or negatives is more critical for the specific application.
- 🎬 The StatQuest series uses visual aids and examples to make complex concepts more accessible, as demonstrated by the application of logistic regression and random forest models.
- 📚 The script concludes with a reminder of the formulas for sensitivity and specificity and their utility in deciding the best machine learning method for a given dataset.
- 🎥 The presenter, Josh Starmar, encourages viewers to subscribe for more content and offers original songs as a support option for the StatQuest series.
Q & A
What are sensitivity and specificity in the context of machine learning?
-Sensitivity and specificity are metrics used to evaluate the performance of a machine learning model, particularly in binary classification tasks. Sensitivity, also known as recall or true positive rate, measures the proportion of actual positives that were correctly identified by the model. Specificity, on the other hand, measures the proportion of actual negatives that were correctly identified by the model.
How is sensitivity calculated for a confusion matrix with two rows and two columns?
-Sensitivity is calculated by dividing the number of true positives by the sum of true positives and false negatives. In the context of a binary classification confusion matrix, true positives are the cases where the model correctly predicted the presence of the condition (e.g., heart disease), and false negatives are the cases where the model failed to predict the presence of the condition.
How is specificity calculated for a confusion matrix with two rows and two columns?
-Specificity is calculated by dividing the number of true negatives by the sum of true negatives and false positives. True negatives are the cases where the model correctly predicted the absence of the condition, and false positives are the cases where the model incorrectly predicted the presence of the condition.
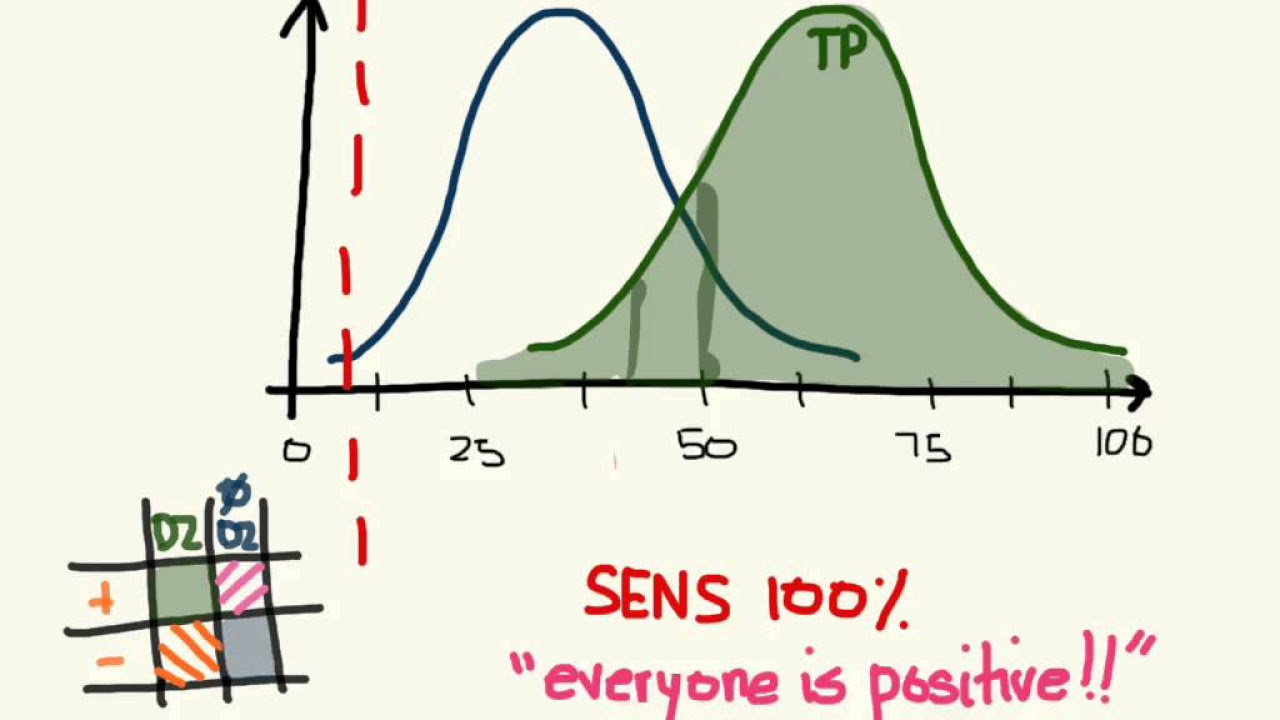
What does a high sensitivity value indicate about a machine learning model?
-A high sensitivity value indicates that the machine learning model is good at correctly identifying positive cases. This means that the model has a low false negative rate and is less likely to miss predicting the presence of the condition of interest.
What does a high specificity value indicate about a machine learning model?
-A high specificity value indicates that the machine learning model is good at correctly identifying negative cases. This means that the model has a low false positive rate and is less likely to incorrectly predict the presence of the condition.
How do you interpret the results of sensitivity and specificity when comparing two models?
-When comparing two models using sensitivity and specificity, you would look at which model has higher values for the outcomes that are more important for the specific application. If correctly identifying positive cases is more critical, you would prefer the model with the higher sensitivity. Conversely, if correctly identifying negative cases is more important, you would choose the model with the higher specificity.
What happens when you have a confusion matrix with more than two categories?
-When dealing with a confusion matrix that has more than two categories, you calculate a different sensitivity and specificity for each category. This means that for each class (or category), you will have its own set of true positives, false positives, true negatives, and false negatives, and you will calculate the metrics separately based on these values.
How does the logistic regression model perform in terms of sensitivity and specificity in the given example?
-In the example provided, the logistic regression model has a sensitivity of 0.81 (or 81%), meaning it correctly identified 81% of the patients with heart disease. Its specificity is 0.85 (or 85%), indicating that it correctly identified 85% of the patients without heart disease.
How does the random forest model compare to the logistic regression model in terms of sensitivity and specificity in the example?
-The random forest model has a slightly lower sensitivity of 0.83 (or 83%), indicating it is slightly better at correctly identifying patients with heart disease compared to the logistic regression model. However, its specificity is the same as the logistic regression model at 0.85 (or 85%), showing no difference in correctly identifying patients without heart disease.
What is the significance of calculating sensitivity and specificity for each category in a multi-class confusion matrix?
-Calculating sensitivity and specificity for each category in a multi-class confusion matrix allows us to understand the performance of the machine learning model for each individual class. This is important because different classes may have different costs associated with false positives or false negatives, and understanding these metrics for each class can help in making more informed decisions about the model's application.
How can the confusion matrix be used to improve machine learning models?
-The confusion matrix provides a detailed breakdown of a model's performance, including true positives, true negatives, false positives, and false negatives. By analyzing these values, we can identify areas where the model is performing well and areas where it may need improvement. For instance, if the model has a low sensitivity for a particular class, it might indicate that the model is often failing to predict that class, which could lead to adjustments in the model's training or parameters to better recognize that class.
Why is it important to consider both sensitivity and specificity when choosing a machine learning model?
-Both sensitivity and specificity are important because they provide complementary information about a model's performance. Sensitivity focuses on the model's ability to correctly identify positive cases, which is crucial when the cost of missing a positive case is high. Specificity focuses on the model's ability to correctly identify negative cases, which is important when the cost of a false positive is significant. Depending on the context and the goals of the application, one might prioritize either sensitivity or specificity, or strive for a balance between the two.
Outlines
📊 Introduction to Sensitivity and Specificity in Machine Learning
This paragraph introduces the concepts of sensitivity and specificity in the context of machine learning, specifically focusing on their role in evaluating the performance of classification models. The video begins with an explanation of how to calculate and interpret these metrics using a confusion matrix with two categories: presence or absence of heart disease. The host, Josh, clarifies that sensitivity measures the percentage of correctly identified positive cases (true positives), while specificity measures the percentage of correctly identified negative cases (true negatives). The paragraph sets the stage for a deeper dive into these metrics, emphasizing their importance in decision-making for machine learning models.
🌳 Comparing Logistic Regression and Random Forest Models
In this paragraph, the video script compares the performance of two machine learning models—logistic regression and random forest—using sensitivity and specificity as the evaluation criteria. The script provides a detailed calculation of these metrics for both models based on a given confusion matrix. It explains that logistic regression has a higher specificity, meaning it is slightly better at correctly identifying patients without heart disease, while the random forest model has a higher sensitivity, indicating it is slightly more accurate in identifying patients with heart disease. The comparison helps viewers understand how to choose between models based on the importance of correctly identifying positive or negative cases.
🎬 Sensitivity and Specificity in Multi-Class Classification
This paragraph extends the discussion on sensitivity and specificity to scenarios where the confusion matrix has more than two rows and columns, representing multi-class classification problems. The script explains that different sensitivity and specificity values must be calculated for each category, providing an example with a confusion matrix predicting favorite movies among 'Troll 2', 'Gore Police', and 'Cool as Ice'. The detailed calculations for each movie category illustrate how to determine the model's performance in correctly identifying each class. The paragraph emphasizes the complexity of evaluating multi-class models and the importance of understanding sensitivity and specificity for each category.
🚀 Conclusion and Final Thoughts on Sensitivity and Specificity
The final paragraph wraps up the discussion on sensitivity and specificity, reiterating their formulas and significance in machine learning. It summarizes the key points discussed in the video, highlighting the use of these metrics to decide on the most suitable machine learning method based on whether correctly identifying positives or negatives is more critical. The host, Josh, encourages viewers to subscribe for more content and offers his original songs as a support option, ending the video on a positive and engaging note.
Mindmap
Keywords
💡Sensitivity
💡Specificity
💡Confusion Matrix
💡True Positives
💡False Negatives
💡True Negatives
💡False Positives
💡Logistic Regression
💡Random Forest
💡Machine Learning Fundamentals
Highlights
The video continues the series on machine learning fundamentals, focusing on sensitivity and specificity.
Sensitivity and specificity are clearly explained using the context of a confusion matrix.
The video builds upon the previous StatQuest episode that described the confusion matrix.
When having a binary classification problem, such as predicting heart disease, the confusion matrix has two rows and two columns.
True positives are patients with heart disease who were correctly predicted to have it.
True negatives are patients without heart disease who were correctly predicted not to have it.
False negatives occur when a patient has heart disease but is incorrectly predicted not to.
False positives happen when a patient does not have heart disease but is incorrectly predicted to have it.
Sensitivity is calculated as true positives divided by the sum of true positives and false negatives.
Specificity is calculated as true negatives divided by the sum of true negatives and false positives.
The video demonstrates how to calculate sensitivity and specificity for a logistic regression model using a given confusion matrix.
The logistic regression model correctly identified 81% of patients with heart disease (sensitivity) and 85% of patients without heart disease (specificity).
The video also compares the performance of the logistic regression model to a random forest model in terms of sensitivity and specificity.
For a multi-class classification problem, like predicting a favorite movie from three options, a different sensitivity and specificity must be calculated for each category.
The sensitivity and specificity for the movie 'Troll 2' were calculated, showing that only 6% of those who truly preferred it were correctly identified.
The specificity for 'Troll 2' was 52%, indicating that 52% of those who preferred other movies were correctly identified.
The process for calculating sensitivity and specificity is the same for other categories, such as 'Gore Police' and 'Cool as Ice'.
In summary, the choice between different machine learning models can be guided by whether correctly identifying positives or negatives is more critical.
The video concludes by emphasizing the practical use of sensitivity and specificity in choosing the best machine learning method for a given dataset.
Viewers are encouraged to subscribe for more StatQuest content and consider supporting the channel through purchasing original songs.
Transcripts


5.0 / 5 (0 votes)
Thanks for rating: