Quadratic Regression TI 84
TLDRThe video script outlines a step-by-step process for determining the best regression model for a given data set. It emphasizes the importance of first visualizing the data through a scatter plot, using technology such as a TI-84 calculator to input data and plot the graph. The video highlights that the shape of the scatter plot dictates the type of regression model to use, in this case, a quadratic model due to the parabolic trajectory observed. The script also explains how to calculate and interpret the regression equation, including the significance of the R-squared value in assessing the model's explanatory power.
Takeaways
- 📊 Start by examining a scatter plot to understand the data's distribution and possible trends.
- 🖥️ Utilize technology, like a TI-84 calculator, to assist in creating the scatter plot and analyzing the data.
- 📝 Enter the x-coordinates into list L1 and the y-coordinates into list L2 on the calculator.
- 🔍 Ensure that the data points match correctly to avoid errors in the regression model.
- 📈 Use the calculator's 'Zoom Stat' feature to adjust the window to fit all data points.
- 🚀 Identify the type of trajectory (e.g., parabolic) to choose the best regression model (e.g., quadratic).
- 📊 Choose from various regression options: linear, quadratic, cubic, quartic, and others.
- 🔧 Store the regression equation in 'Y VARS' to graph the model alongside the scatter plot.
- 📈 Interpret the R-squared value, which indicates the percentage of data explained by the model (closer to 1, stronger the model).
- 📝 Write down the model equation, rounding coefficients to appropriate decimal places for clarity.
- 🎯 Check the graph to ensure the model closely fits the data points, identifying any outliers or variability.
Q & A
What is the main topic of the video?
-The main topic of the video is finding the best regression equation to model a given set of data.
What is the first step in determining the best model for the data?
-The first step is to look at the scatter plot of the data, either by drawing it by hand or using technology like a calculator.
Which technology tool does the video demonstrate for data analysis?
-The video demonstrates the use of a TI-84 calculator for entering data and performing regression analysis.
How does the video ensure that the data points are correctly entered into the calculator?
-The video emphasizes matching the x-coordinates with the corresponding y-coordinates to avoid errors in the model.
What type of trajectory does the data in the video exhibit?
-The data exhibits a parabolic trajectory, going up and then coming back down.
Why is a quadratic model considered the best fit for this data set?
-A quadratic model is considered the best fit because the data shows a parabolic shape, which is characteristic of a quadratic equation.
What are the different types of regression models available on the calculator?
-The calculator offers linear regression, quadratic regression, cubic regression, quartic regression, linear regression with a different form, natural logarithm regression, and more.
How is the strength of the regression model measured?
-The strength of the regression model is measured by the R-squared value, which indicates the percentage of data variability explained by the model.
What does an R-squared value close to one signify?
-An R-squared value close to one indicates a very strong model, meaning almost all the data points are explained by the model.
How can the viewer check if their calculator has the option to display R-squared?
-The viewer can check by going to the mode settings and enabling stats diagnostics, or by following the video's instructions for their specific calculator model.
What does the video recommend for further engagement with the content?
-The video recommends that viewers ask additional questions, suggest topics for future videos, and subscribe for more content.
Outlines
📊 Introduction to Finding the Best Regression Model
This paragraph introduces the video's objective, which is to find the best regression model to fit a given data set. The speaker explains that although they already know which model is best, they want to guide the viewers through the process of determining the best fit. The first step involves examining a scatter plot, which can be done manually or with the aid of technology. The speaker chooses to use a TI-84 calculator to input the data into lists L1 and L2, emphasizing the importance of accurate data pairing to avoid errors in the model. The speaker then proceeds to adjust the calculator's display for better visibility and moves on to the next steps of the process.
📈 Analyzing Data with Scatter Plot and Regression Options
In this paragraph, the speaker discusses the importance of analyzing the scatter plot to determine the nature of the data's trajectory before selecting a regression model. They demonstrate how to use the TI-84 calculator to plot the data and adjust the windows to fit all data points. The speaker observes a parabolic trajectory, indicating that a quadratic model is the most suitable choice. The video then outlines the various regression options available on the calculator, including linear, quadratic, cubic, and quartic regression, as well as natural logarithm regression. The speaker selects quadratic regression and explains how to store the regression equation in the calculator's 'Y=' function for further analysis. The paragraph concludes with an explanation of the R-squared value, which indicates the percentage of data variability explained by the model, highlighting that a value close to one signifies a strong model.
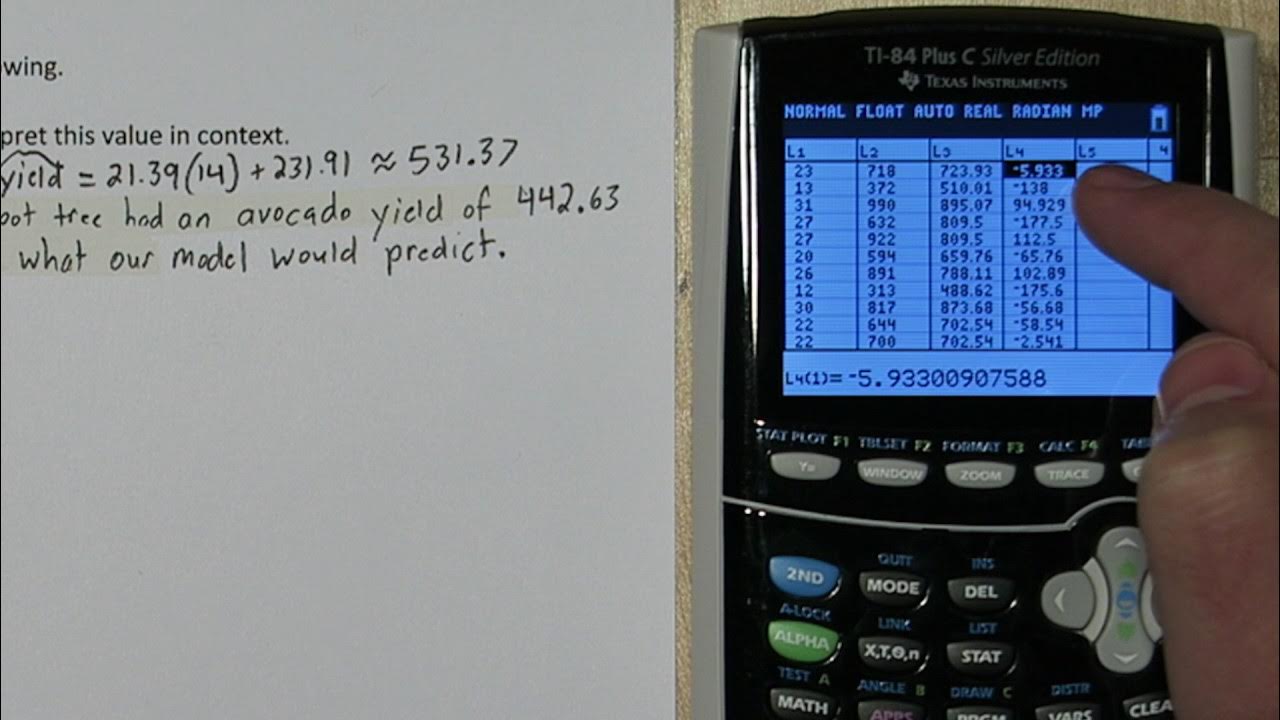
🔢 Calculating and Interpreting the Regression Model
This paragraph delves into the specifics of calculating and interpreting the regression model using the TI-84 calculator. The speaker demonstrates how to input the data for quadratic regression and how to enable the R-squared display for older calculator models that may not have this feature by default. The speaker then shows how to enter the regression equation into the calculator and interpret the results. They provide a detailed example of the regression equation, rounding the coefficients to four decimal places, and explain the meaning of the R-squared value, which in this case is very close to one, indicating a very strong model. The speaker also discusses the scatter plot's appearance on the calculator, noting that the model fits the data points well, with only minor variability in one point. The video concludes with a call to action for viewers to suggest additional topics and to subscribe for more content.
Mindmap
Keywords
💡Regression
💡Scatter Plot
💡TI-84 Calculator
💡Quadratic Regression
💡R-squared
💡Data Points
💡Model
💡Coefficients
💡Graphing
💡Diagnostics
💡Variability
Highlights
The video demonstrates how to find the best regression model for a given data set.
The importance of examining a scatter plot before choosing a model is emphasized.
The use of technology, specifically the TI-84 calculator, is introduced to assist in the process.
Instructions on how to input data into lists on the calculator are provided.
The necessity of matching x and y coordinates correctly is stressed to avoid errors.
The video shows how to plot and analyze data points to determine the trajectory.
It is explained that a parabolic trajectory indicates a quadratic regression model is suitable.
The process of selecting and using the quadratic regression option on the calculator is detailed.
The explanation of how to store the regression equation for further use is given.
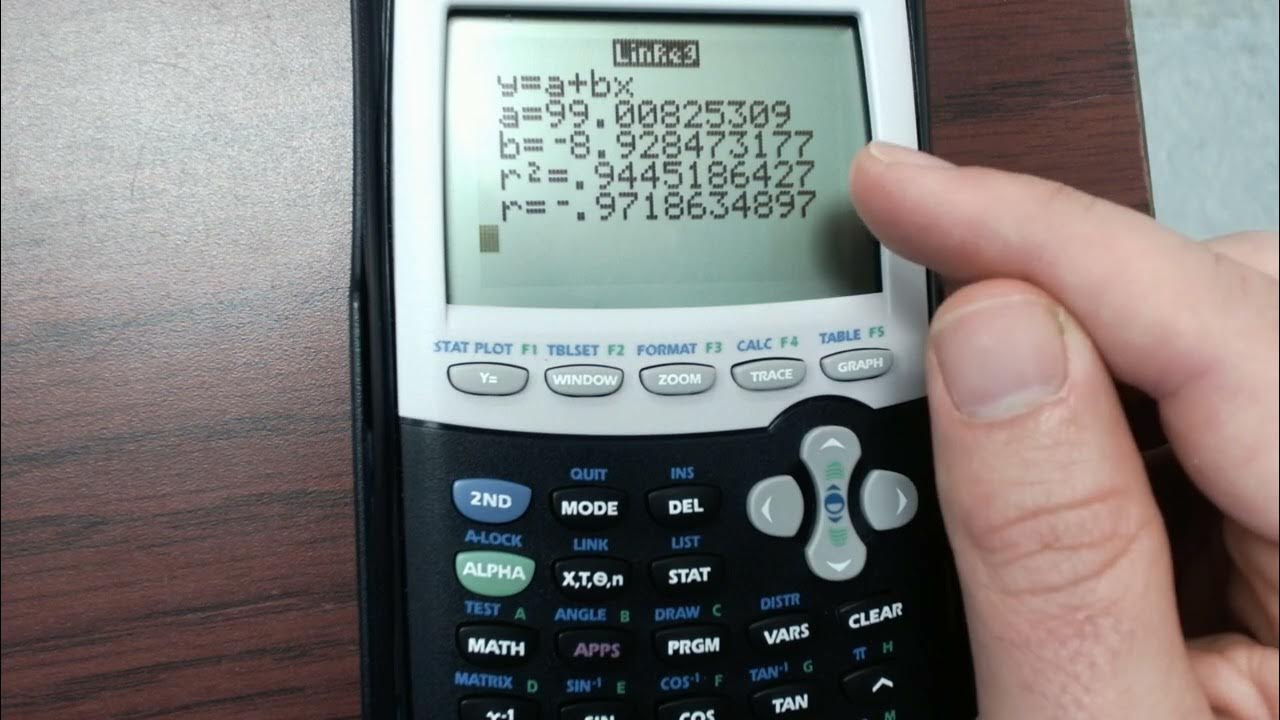
The significance of R-squared in evaluating the strength of the regression model is discussed.
The final quadratic regression equation is presented and explained.
The video provides guidance for those without access to certain calculator features.
A method for enabling stats diagnostics on older calculator models is shared.
The video concludes by showing how the model fits the data points on the graph.
The importance of choosing the right model to accurately represent data is reiterated.
The video encourages viewers to suggest topics for future content and to subscribe for more.
Transcripts
Browse More Related Video
Calculating Residuals & Making Residual Plots on TI-84 Plus

How to do Linear Regression on the TI84 Plus CE

Pre-Calculus - Find the linear regression line using the TI-83/84 calculator (2)

Least Squares Regression Line on the TI83 TI84 Calculator
Residual Plot on TI-84 Plus
Simple Linear Regression in R | R Tutorial 5.1 | MarinStatsLectures
5.0 / 5 (0 votes)
Thanks for rating: