Top 10 Tips for AP Statistics Unit 2 Exploring Two Variable Data
TLDRThis video offers a comprehensive guide for AP Statistics students, focusing on Unit 2. It emphasizes the importance of understanding proportions from categorical data, determining associations between categorical variables, describing scatter plots, and interpreting correlation. The video also explains the least squares regression line, its interpretation, and when it's appropriate to use. Lastly, it covers how to read a linear regression output table, equipping students with the knowledge to excel in their unit tests and the AP exam.
Takeaways
- 📊 Be cautious with proportions from categorical data, as a higher proportion does not necessarily equate to a higher number without knowing the group sizes.
- 🔍 Determine associations between categorical variables using two-way tables and compare marginal and conditional distributions.
- 📈 Describe scatter plots by considering the direction, form, strength, and context of the data.
- 🔗 Understand correlation as a measure of the direction and strength of a linear relationship between two quantitative variables.
- 🤝 Know the least squares regression line formula (Y = a + BX) and its use for predicting Y based on X.
- 📉 Interpret the slope (B) of the least squares regression line as the predicted change in Y for a one-unit change in X.
- 🏁 Recognize that the y-intercept (a) represents the predicted Y value when X equals zero, though it may not always make contextual sense.
- 🧐 Assess the appropriateness of a least squares regression line by examining the scatter plot's linearity and the residual plot's lack of pattern.
- 🔍 Evaluate the reliability of a regression line using r-squared to measure the percentage of explained variation and s for the standard deviation of residuals.
- 📋 Read and interpret linear regression output tables to extract the y-intercept, slope, r-squared, and S values.
Q & A
What is the main focus of the video?
-The main focus of the video is to cover the top 10 most important concepts for AP Statistics Unit 2, which will help students not only ace their unit 2 tests but also perform well on the AP exam in May.
What is the ultimate review pack mentioned in the video and how does it help students?
-The ultimate review pack is a resource created for AP Statistics students that includes study guides, practice multiple-choice questions, practice up argues, and full-length practice tests. It helps students prepare for every single unit and the entire course, ultimately assisting them in doing well in class and on the AP exam.
Why should one be careful when comparing proportions from categorical data?
-One should be careful when comparing proportions from categorical data because a higher proportion in one group does not necessarily mean a higher number of people in that group. This is due to the fact that we may not know the sample sizes of the groups, and thus direct comparisons of proportions can be misleading without knowing the actual numbers.
How can one determine if there is an association between two categorical variables?
-To determine if there is an association between two categorical variables, one should look at a two-way table and compare the marginal distributions with the conditional distributions. If the conditional relative frequencies are similar across the groups, it suggests no association. However, if they differ significantly, it indicates an association between the variables.
What are the four important aspects to describe when analyzing a scatter plot?
-When analyzing a scatter plot, it is important to describe the direction of the scatter plot, the form of the scatter plot (whether it is linear or not), the strength of the scatter plot (how closely the points form a pattern), and to discuss the scatter plot in context, using relevant terminology from the problem at hand.
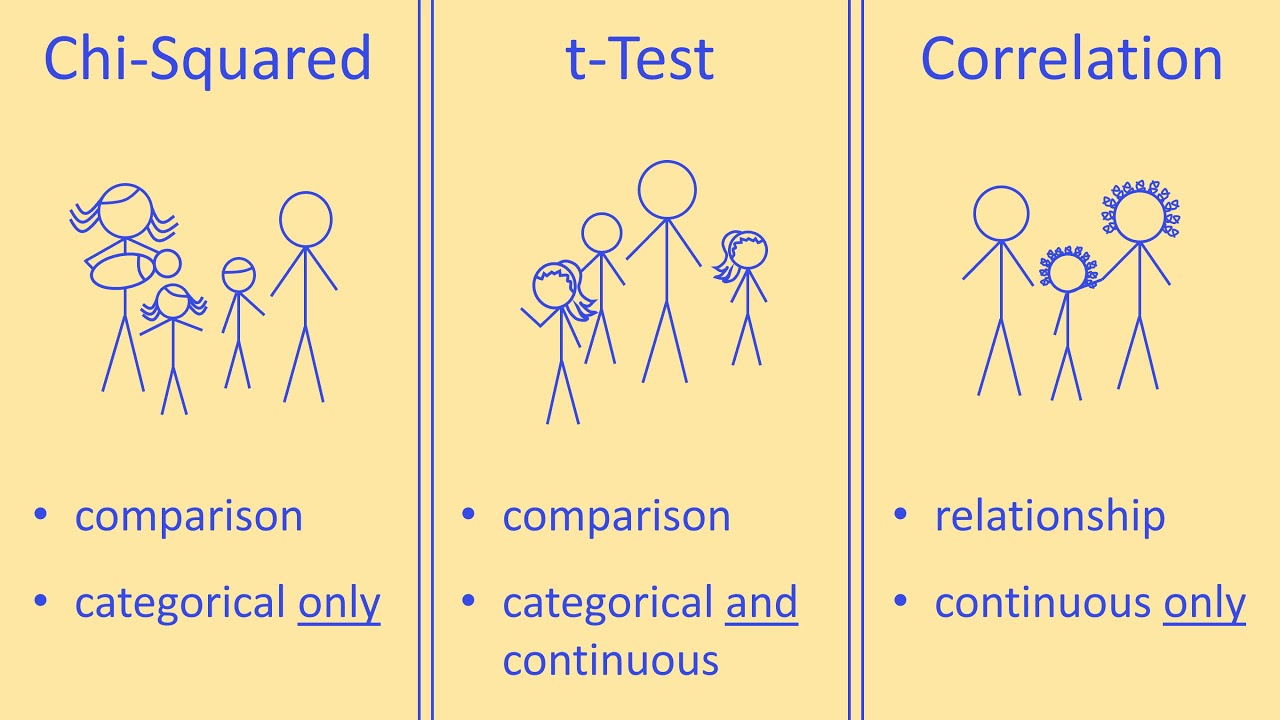
What is correlation and what are its key features?
-Correlation is a specific value that measures the direction and strength of a linear relationship between two quantitative variables. Its key features include the fact that it is a number ranging from -1 to 1, inclusive, with -1 indicating a perfect negative straight line, 1 indicating a perfect positive straight line, and values closer to zero indicating weaker relationships. Correlation measures only work with linear data and cannot be used with categorical variables.
What is the formula for the least squares regression line and how is it used?
-The formula for the least squares regression line is Y hat equals a plus BX, where Y hat is the predicted value, a is the y-intercept, B is the slope, and X is the explanatory variable. The line is used to predict the value of Y for a given X by plugging the X value into the formula. It is important to note that the line should not be used for extrapolation outside the range of the data that generated it.
How is the slope of a least squares regression line interpreted?
-The slope of a least squares regression line (B) indicates how much the Y variable is predicted to change based on a one-unit increase in the X variable. For example, if the slope is 7.052, it means that for every one-inch increase in the X variable (beard length of a turkey), the Y variable (weight) is predicted to increase by 7.052 pounds.
What does the y-intercept of a least squares regression line represent?
-The y-intercept (a) of a least squares regression line represents the predicted value of Y when X equals zero. It is important to note that while the y-intercept can sometimes be meaningful in context, it may not always make sense, especially if the X value of zero is not represented in the data set.
How can one determine if a least squares regression line is appropriate for the data?
-To determine if a least squares regression line is appropriate, one should examine the original scatter plot to ensure it appears somewhat linear and then look at the residual plot to ensure there is no pattern. A linear scatter plot and a residual plot with no discernible pattern indicate that a least squares regression line is suitable for the data.
What does the reliability of a least squares regression line depend on?
-The reliability of a least squares regression line depends on two values: the coefficient of determination (r-squared) and the standard deviation of the residuals (s). A high r-squared value indicates a strong connection between the X and Y variables, while a low s value indicates that predictions are typically off by a small amount, making the line more reliable for making predictions.
How can one interpret a linear regression output table?
-A linear regression output table typically provides the y-intercept (a) and the slope (B) in the first column marked 'coefficients'. The r-squared value and the S value (standard deviation of the residuals) are also included in the table, which provide insights into the reliability of the regression line. The table can be used to recreate the least squares regression line formula and assess its predictive reliability.
Outlines
📊 Top 10 AP Statistics Unit 2 Concepts
This paragraph introduces the video's purpose, which is to cover the top 10 most important concepts for the AP Statistics unit 2. The speaker emphasizes the significance of these concepts not only for the unit test but also for the AP exam in May. The speaker also introduces the ultimate review pack, a resource designed to help students practice and prepare for their exams. The review pack includes study guides, practice multiple-choice questions, and full-length practice tests. The speaker encourages students to take advantage of the free trial and access exclusive videos that will eventually become part of the paid content.
🔍 Proportions and Categorical Data
The speaker discusses the importance of being cautious when interpreting proportions from categorical data. Using a segmented bar graph as an example, the speaker explains that a higher proportion in one group does not necessarily mean a higher number of individuals in that group. The speaker warns against making assumptions based on relative frequencies without knowing the sample sizes. The concept is illustrated with an example of students' tardiness related to their mode of transportation to school, emphasizing the need to compare actual numbers rather than just proportions.
🔗 Determining Association Between Categorical Variables
This paragraph focuses on how to determine if there is an association between two categorical variables by examining a two-way table. The speaker uses the example of tardy students and their transportation methods to school to illustrate the concept. The speaker explains the importance of understanding marginal and conditional distributions and how they can be used to identify associations. The speaker also introduces the concept of a segmented bar graph that can visually represent the association between two variables, highlighting the importance of recognizing patterns and making informed conclusions based on the data.
📈 Describing and Interpreting Scatter Plots
The speaker explains how to describe and interpret scatter plots, emphasizing four key aspects: the direction of the scatter plot, its form, its strength, and the context. Using the example of turkeys' beard length and weight, the speaker demonstrates how to analyze and describe the relationship between two quantitative variables. The speaker also discusses the importance of using the correct terminology and providing context when interpreting scatter plots.
📊 Understanding Correlation
In this paragraph, the speaker delves into the concept of correlation, which measures the direction and strength of a linear relationship between two quantitative variables. The speaker clarifies that correlation is specific to linear data and cannot be used for categorical variables. The speaker explains that correlation values range from -1 to 1, with -1 indicating a perfect negative linear relationship, 1 indicating a perfect positive linear relationship, and values closer to zero indicating weaker relationships. The speaker also mentions that correlation is unitless and should not be modified with any units.
🧮 Least Squares Regression Line
The speaker introduces the least squares regression line, a statistical tool used to predict the value of a dependent variable based on the value of an independent variable. The speaker explains the formula for the least squares regression line (Y hat equals a plus BX) and emphasizes that it can only be used in one direction. The speaker also discusses the concept of residuals and how the least squares regression line is the best line because it has the smallest sum of squared residuals. The speaker provides an example of how to calculate the least squares regression line using the turkey data and explains the importance of not extrapolating beyond the range of the data.
📈 Interpreting the Slope and Y-Intercept
The speaker explains how to interpret the slope and y-intercept of the least squares regression line. The slope (B) represents the predicted change in the Y variable for each unit change in the X variable. The speaker uses the turkey example to illustrate this concept, explaining that a one-inch increase in beard length predicts a 7.052-pound increase in weight. The y-intercept (a) represents the predicted value of Y when X equals zero. The speaker notes that while the y-intercept may not always make sense in context, it is still an important part of the regression equation.
🤔 Is the Least Squares Regression Line Appropriate?
The speaker discusses how to determine if a least squares regression line is appropriate for the data. Two key factors are examined: the original scatter plot and the residual plot. The speaker emphasizes that the scatter plot should be somewhat linear and the residual plot should show no pattern. If these conditions are met, the least squares regression line is considered appropriate for making predictions based on the data.
🛠️ Reliability of the Least Squares Regression Line
The speaker explores the reliability of the least squares regression line for making predictions. Two main indicators of reliability are discussed: R-squared and the standard deviation of the residuals (s). R-squared, or the coefficient of determination, represents the percentage of variation in the Y variable that is explained by the variation in the X variable. A high R-squared value indicates a strong connection between the variables, making the regression line more reliable. The standard deviation of the residuals (s) measures the typical error in predictions made using the regression line. A lower s value indicates that predictions are generally more accurate. The speaker uses the turkey example to illustrate these concepts and emphasizes the importance of understanding these values for reliable predictions.
📋 Reading Linear Regression Output Tables
The speaker instructs on how to read and interpret a linear regression output table, which typically comes from a computer program. The speaker identifies the key elements to look for in these tables: the y-intercept (a) and the slope (B), which can be found in the 'Coefficients' column. The speaker also mentions the R-squared and S values, which are important for assessing the reliability of the regression line. The speaker provides a clear example of how to extract and use the information from a linear regression output table to recreate the least squares regression line equation and assess its reliability.
Mindmap
Keywords
💡Proportions
💡Two-Way Table
💡Scatter Plot
💡Correlation
💡Least Squares Regression Line
💡Slope
💡Y-Intercept
💡Residual Plot
💡R-Squared
💡Standard Deviation of Residuals (S)
💡Linear Regression Output Table
Highlights
The video covers the top 10 most important concepts for AP Statistics Unit 2.
The ultimate review pack for AP Statistics is available for practice and preparation.
Be cautious when comparing proportions from categorical data without knowing the group sizes.
Determine association between two categorical variables using a two-way table and marginal distributions.
Describe a scatter plot by its direction, form, strength, and context.
Correlation measures the direction and strength of a linear relationship between two quantitative variables.
The least squares regression line formula is Y hat equals a plus BX, where a is the y-intercept and B is the slope.
Interpret the slope of a least squares regression line as the predicted change in Y based on a one-unit change in X.
Understand the y-intercept as the predicted Y value when X equals zero.
Determine the appropriateness of a least squares regression line by examining the scatter plot and residual plot.
Assess the reliability of a least squares regression line using the r-squared value and the standard deviation of residuals (s).
Read and interpret a linear regression output table for the y-intercept, slope, r-squared, and S value.
The video aims to help students not only ace their unit 2 test but also perform well on the AP exam in May.
The importance of recognizing when proportions are the same across groups, indicating no association.
The significance of changes in proportions indicating an association between variables.
The four key elements to describing a scatter plot: direction, form, strength, and context.
The necessity of having linear data to use correlation and the importance of the correlation's range from -1 to 1.
Transcripts
Browse More Related Video

Elementary Stats Lesson #5

AP Statistics Unit 6 Summary Review Inference For Proportions Part 1 Confidence Intervals

HOW TO READ A COMPUTER OUTPUT FOR REGRESSION AP STATISTICS
Choosing a Statistical Test for Your IB Biology IA
Simple Linear Regression in R | R Tutorial 5.1 | MarinStatsLectures

Fitting Models Is like Tetris: Crash Course Statistics #35
5.0 / 5 (0 votes)
Thanks for rating: