Why distance is area under velocity-time line | Physics | Khan Academy
TLDRThe video script discusses the concept of constant velocity and acceleration, and how they relate to displacement over time. It explains that the distance traveled can be calculated by multiplying velocity by time, and that the area under the velocity-time curve represents the distance. The example of an object moving at a constant velocity of 5 meters per second for 5 seconds results in a displacement of 25 meters. The script further explores the scenario of an object with zero initial velocity and a constant acceleration of 1 meter per second squared for 5 seconds, leading to a displacement of 12.5 meters. This is derived from the area of a triangle formed by the acceleration line and the time axis. The video emphasizes understanding the relationship between velocity, acceleration, and displacement in physics.
Takeaways
- 🚀 An object moving with a constant velocity of 5 m/s to the right can be represented as a vector quantity.
- 📈 Plotting the magnitude of velocity against time for a constant velocity results in a horizontal line, as the velocity does not change over time.
- 🛣️ The distance traveled by an object with constant velocity is calculated by multiplying the velocity by the time (5 m/s * 5 s = 25 m).
- 📊 The area under the velocity vs. time curve represents the displacement or distance traveled by the object.
- 🔄 When velocity is changing, smaller rectangles can be used to approximate the area under the curve, which represents the distance traveled.
- 🚀 An initial velocity of zero with a constant acceleration of 1 m/s² over 5 seconds results in a final velocity of 5 m/s.
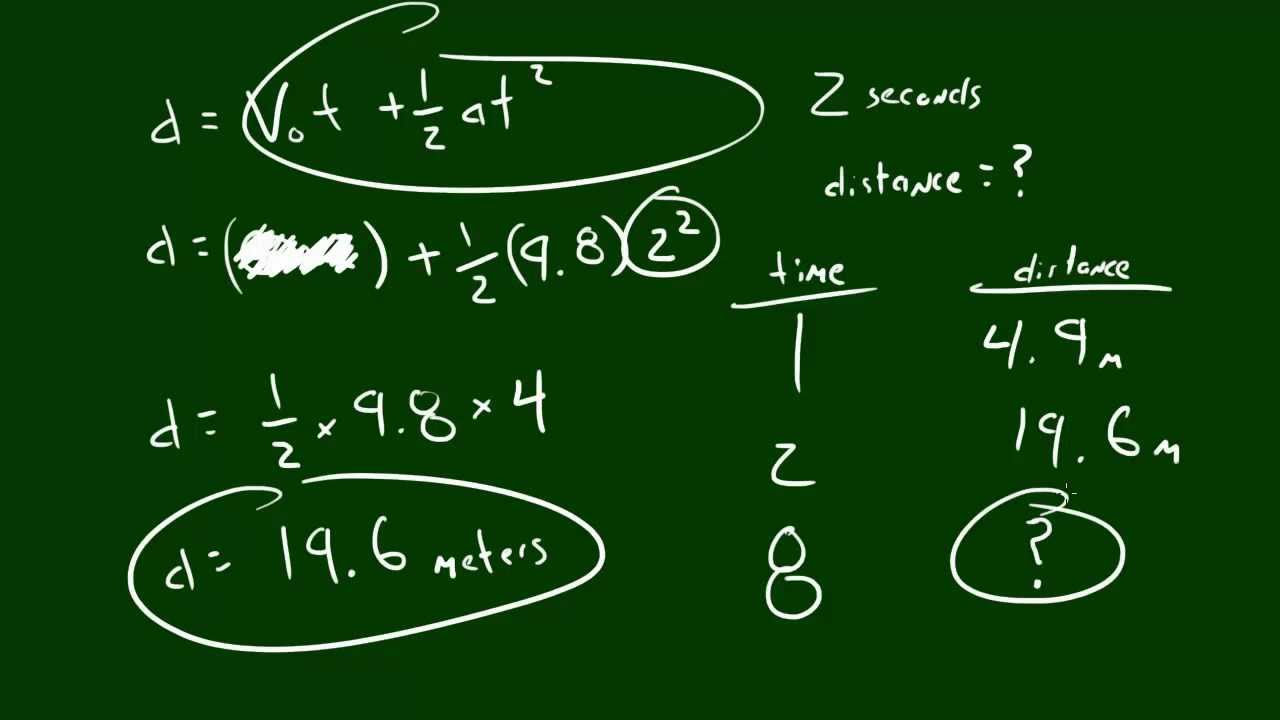
- 🛤️ The displacement for an object with constant acceleration can be calculated using the area under the curve, which in this case forms a triangle.
- 📐 The area of the triangle (and thus the displacement) is found using the formula: 1/2 * base * height (1/2 * 5 s * 5 m/s = 12.5 m).
- 📈 The slope of the velocity vs. time curve indicates the acceleration of the object; a flat line indicates no acceleration (zero change in velocity).
- 🔢 The concept of the area under the velocity vs. time curve can be used to determine the distance traveled, even with variable acceleration.
- 🌟 Average velocity is a concept that will be introduced in a subsequent video, building upon the understanding of the velocity vs. time curve.
Q & A
What is the constant velocity mentioned in the script?
-The constant velocity mentioned in the script is five meters per second.
In which direction is the object moving?
-The object is moving to the right, as specified in the script.
How is the magnitude of velocity represented in the graph?
-The magnitude of velocity is represented by plotting only the magnitude against time on the velocity axis.
What is the relationship between velocity and displacement?
-Velocity is equal to displacement over change in time. Displacement can be calculated by multiplying velocity by the change in time.
How far does the object travel after five seconds with a constant velocity?
-The object travels 25 meters after five seconds with a constant velocity of five meters per second (5 m/s * 5 s = 25 m).
What is the significance of the area under the velocity vs. time curve?
-The area under the velocity vs. time curve represents the distance traveled or the displacement of the object.
What is the initial velocity and acceleration in the second scenario described in the script?
-In the second scenario, the initial velocity is zero, and the acceleration is one meter per second squared.
How does the shape of the velocity vs. time graph change when there is acceleration?
-When there is acceleration, the graph is no longer a flat line; instead, it becomes a sloped line, representing the constant acceleration.
What is the total distance traveled with constant acceleration over a period of five seconds?
-With constant acceleration of one meter per second squared over five seconds, the total distance traveled is 12.5 meters, calculated as half the product of the time interval (5 seconds) and the final velocity (5 m/s).
How can the area under the curve be calculated for the second scenario with constant acceleration?
-The area under the curve for the second scenario forms a triangle, and the area of a triangle is calculated as half the product of its base and height (1/2 * base * height).
What is the concept of average velocity introduced at the end of the script?
-The concept of average velocity is introduced as a measure that could be derived from the velocity vs. time curve, but it is not explained in detail within the provided script content.
Outlines
🚀 Constant Velocity and Displacement
This paragraph introduces a scenario where an object moves with a constant velocity of five meters per second to the right, representing it as a vector quantity. The讲师 plots the magnitude of velocity against time, emphasizing that the velocity does not change over time. The讲师 then poses a question about the distance traveled by the object after five seconds. The explanation unfolds using the formula for displacement, which is velocity multiplied by the change in time. By applying this formula, the讲师 calculates the displacement to be 25 meters after five seconds. Additionally, the讲师 highlights that the area under the rectangle in the velocity-time graph represents the distance traveled. The concept is further illustrated by considering a changing velocity scenario with constant acceleration, where the讲师 explains how the displacement can be found by summing up the areas of smaller rectangles under the curve.
📈 Acceleration and the Area Under the Curve
In this paragraph, the讲师 explores the concept of acceleration and its representation on a velocity-time graph. The讲师 describes a situation where an object starts with an initial velocity of zero and accelerates at a rate of one meter per second squared for five seconds. The讲师 then discusses how to calculate the distance traveled in this accelerated scenario. The讲师 visually represents this by drawing rectangles to approximate the area under the curve, suggesting that smaller rectangles would yield a more accurate result. The讲师 refines this approach by splitting the rectangles into smaller time intervals to better approximate the area. The讲师 then reveals that the area under the curve in this case forms a triangle, for which the讲师 uses the formula for the area of a triangle (1/2 * base * height) to calculate the distance traveled as 12.5 meters. The paragraph concludes with the讲师 emphasizing two key takeaways: the area under the velocity-time curve represents the distance traveled, and the slope of the curve indicates the acceleration. The讲师 also mentions that even with constant acceleration, the distance can be determined by calculating the area under the curve.
Mindmap
Keywords
💡Velocity
💡Displacement
💡Acceleration
💡Time
💡Area under the curve
💡Constant velocity
💡Constant acceleration
💡Rectangle method
💡Slope
💡Distance traveled
💡Average velocity
Highlights
The concept of a constant velocity of five meters per second in a specified direction is introduced.
A method of plotting velocity against time is explained, focusing on the magnitude of velocity.
The relationship between velocity, time, and displacement is discussed, with displacement calculated as velocity multiplied by time.
An example calculation shows that an object with a constant velocity of five meters per second travels 25 meters in five seconds.
The concept of the area under the velocity-time graph representing the distance traveled is introduced.
A scenario with constant acceleration is presented, with an initial velocity of zero and an acceleration of one meter per second squared.
The method of calculating distance traveled under non-constant velocity conditions using rectangles and the concept of 'area under the curve' is explained.
The realization that smaller rectangles provide a more accurate representation of the area under the curve is discussed.
The calculation of distance traveled in the case of constant acceleration is demonstrated, resulting in a displacement of 12.5 meters.
The significance of the slope of the velocity-time graph is highlighted, indicating the rate of change of velocity or acceleration.
The method of determining distance traveled even with constant acceleration by calculating the area under the curve is reiterated.
The impact of the shape of the velocity-time graph on the calculation of distance traveled is discussed, with a flat line indicating no change in velocity.
The transition from a flat velocity-time graph to one with a slope due to constant acceleration is explained.
The concept of average velocity is teased as a topic for the next video, suggesting a continuation of the discussion on velocity and displacement.
The importance of understanding the area under the velocity-time curve as a measure of distance traveled is emphasized.
The practical application of the principles discussed is highlighted, showing how they can be used to calculate the motion of objects under various conditions.
The transcript provides a clear and detailed explanation of the fundamental principles of kinematics, such as velocity, acceleration, and displacement.
The use of visual aids like graphs and geometrical shapes to explain complex concepts makes the content more accessible.
Transcripts

5.0 / 5 (0 votes)
Thanks for rating: