A Tale of Three Functions | Intro to Limits Part I
TLDRThe video script explores the concept of limits by comparing three distinct functions: f(x) = x + 1, g(x) = (x^2 - 1) / (x - 1), and h(x), a piecewise function defined as h(x) = 3 for x = 1 and h(x) = x + 1 for all other x values. The analysis reveals that while f(x) and g(x) are nearly identical, with g(x) having a discontinuity at x = 1 due to division by zero, h(x) differs at the point x = 1, where it takes the value of 3 instead of 2 like f(x). The video emphasizes the importance of understanding the domain and behavior of functions, particularly at points of discontinuity, to appreciate their true nature and differences.
Takeaways
- 📈 The video discusses the concept of limits by comparing three different functions: f(x), g(x), and h(x).
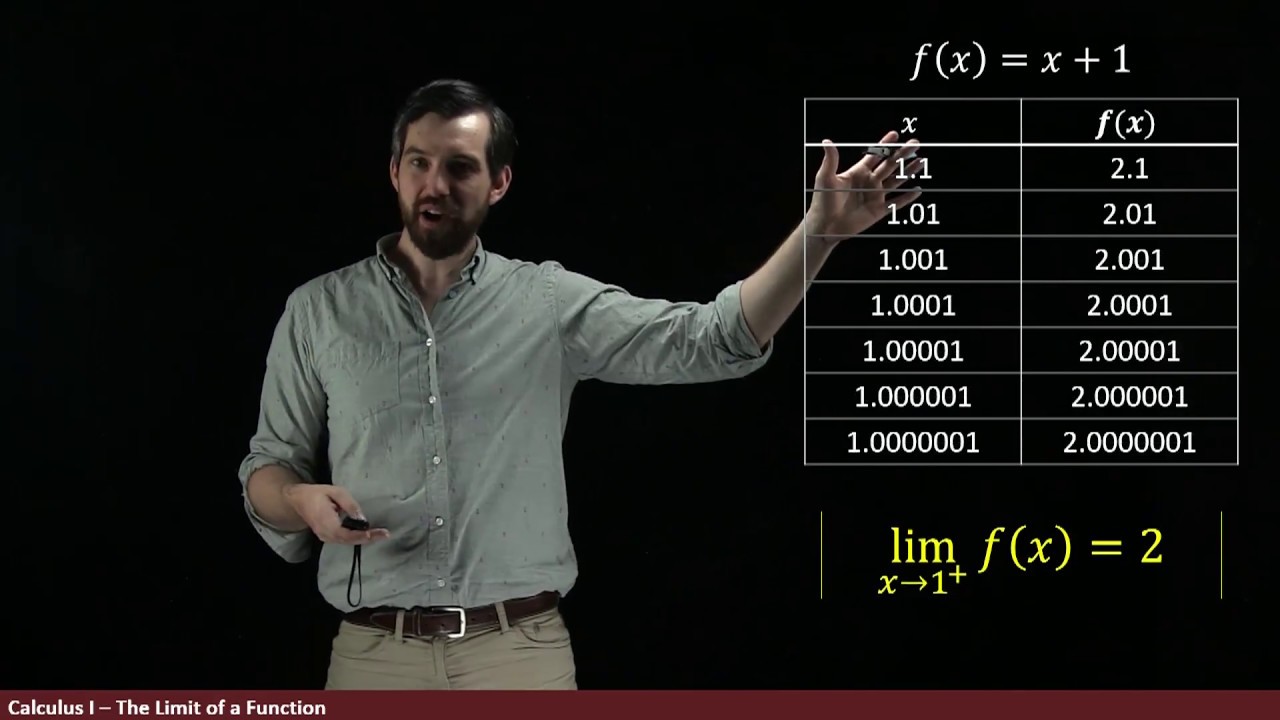
- 🔍 f(x) = x + 1 is a linear function represented by a straight line on the graph.
- 🧩 g(x) = (x^2 - 1) / (x - 1) can be factored to x - 1 * (x + 1)/(x - 1), simplifying to x + 1, except it is not defined at x = 1 due to division by zero.
- 🚫 At x = 1, g(x) is undefined and is represented on the graph with a hole, indicating the function's domain does not include this point.
- 📉 The graph of g(x) is almost identical to f(x), but with a missing point at x = 1, making the domain slightly different.
- 📋 h(x) is a piecewise function with different definitions depending on the value of x: h(1) = 3 and for all other x, h(x) = x + 1.
- 🔵 The graph of h(x) is similar to f(x), but with a distinct point at x = 1 where the value is 3, represented by a filled dot on the graph.
- 🔴 At x = 1, f(x), g(x), and h(x) behave differently: f(1) = 2, g(1) is undefined, and h(1) = 3.
- 🤝 Apart from the point x = 1, the functions f(x) and h(x) are the same, while g(x) differs by being undefined at x = 1.
- ⚖️ The video emphasizes the importance of understanding the domain of a function and how it affects the function's behavior.
- 🔬 Factoring is a useful technique to simplify functions and potentially identify points where the function is not defined.
- 📌 The concept of limits is central to calculus and understanding how functions approach certain values or behave at specific points.
Q & A
What is the basic function introduced at the beginning of the video?
-The basic function introduced at the beginning of the video is f(x) = x + 1, which is represented by a straight line on the graph.
How does the function G of X relate to the function f of X?
-The function G of X is almost the same as f of X, except G of X has a division by zero at x = 1, which means it is not defined at that point, unlike f of X.
What is the mathematical expression for G of X?
-The mathematical expression for G of X is (x^2 - 1) / (x - 1), which can be factored to (x - 1)(x + 1) / (x - 1), simplifying to x + 1 when x is not equal to 1.
Why is there a hole in the graph of G of X at x = 1?
-There is a hole in the graph of G of X at x = 1 because the function is not defined at that point due to division by zero in the original expression.
What is the domain of the function G of X?
-The domain of the function G of X is all real numbers except x = 1, as the function is not defined at that point.
What is the notation for H of X and how does it differ from G of X?
-H of X is a piecewise defined function, which means it has different expressions for different parts of its domain. Unlike G of X, H of X has a specific value of 3 when x = 1 and behaves like x + 1 for all other values.
How does the graph of H of X differ from the graph of f of X?
-The graph of H of X is almost the same as the graph of f of X, except at x = 1 where H of X has a specific value of 3, represented by a filled dot on the graph, instead of following the straight line like f of X.
What is the value of H of X at x = 1?
-The value of H of X at x = 1 is 3, as defined by the piecewise function.
What is the main difference between the functions f of X, G of X, and H of X at x = 1?
-The main difference is their value or behavior at x = 1: f of X is 2, G of X is undefined due to division by zero, and H of X is specifically defined as 3.
What concept is the video trying to illustrate by comparing these three functions?
-The video is trying to illustrate the concept of limits and how small differences in functions can lead to different behaviors, especially at specific points in their domain.
Why is it important to consider the domain when comparing functions?
-It is important to consider the domain when comparing functions because the domain determines the set of all possible input values for which the function is defined, and differences in domain can lead to different function behaviors.
What does the video suggest about the relationship between the formulas of functions and their graphical representation?
-The video suggests that while the formulas of functions can look quite different, their graphical representation might be very similar, but small differences in the formulas can lead to significant differences in the graph, especially at certain points.
Outlines
🔍 Investigating Limits and Function Comparison
The video script begins by introducing the concept of limits through a comparison of three distinct functions: f(x), g(x), and h(x). The aim is to determine if these functions are essentially the same or if they have significant differences. The first function, f(x) = x + 1, is represented by a straight line graph. The second function, g(x) = (x^2 - 1) / (x - 1), initially appears to be similar to f(x), but upon closer inspection, it is revealed that g(x) is not defined at x = 1 due to division by zero. This is represented graphically by a hole at that point. The third function, h(x), is a piecewise function that equals 3 when x = 1 and otherwise behaves like f(x). The graph of h(x) is a straight line with a distinct point at x = 1 with a height of 3. The video emphasizes that while f(x), g(x), and h(x) are largely the same, they differ at the point x = 1, with f(1) = 2, g(1) being undefined, and h(1) = 3.
Mindmap
Keywords
💡Limit
💡Function
💡Graph
💡Factoring
💡Polynomial
💡Domain
💡Division by Zero
💡Piecewise Defined Function
💡Continuity
💡Undefined
💡Value
Highlights
Investigating the concept of a limit by contrasting three different functions: f(x), g(x), and h(x).
f(x) is a linear function defined as x plus 1, represented by a straight line on the graph.
g(x) is a rational function with the potential for simplification by factoring x^2 - 1 as (x - 1)(x + 1).
Simplification of g(x) reveals it is almost identical to f(x), except g(x) is not defined at x = 1 due to division by zero.
The graph of g(x) has a hole at x = 1, indicating the function is undefined at that point.
The domain of g(x) is slightly different from f(x) due to the exclusion of x = 1.
h(x) is a piecewise-defined function with different expressions for x = 1 and all other x values.
At x = 1, h(x) equals 3, differing from both f(x) and g(x) at this specific point.
For all other values except x = 1, h(x) is equivalent to f(x), represented by the same straight line on the graph.
The graph of h(x) has a distinct point at x = 1 with a height of 3, filled in to show the defined value.
Comparing the three functions, f(x), g(x), and h(x) are the same everywhere except at x = 1.
f(1) equals 2, g(1) is undefined, and h(1) equals 3, showing the unique behavior of each function at x = 1.
The concept of limits is explored through the behavior of these functions as x approaches 1.
Understanding the domain restrictions is crucial for accurately defining and comparing functions.
Visual representation through graphs aids in the intuitive understanding of function behavior and limitations.
Piecewise functions allow for distinct behavior under different conditions, providing flexibility in mathematical modeling.
The importance of recognizing when simplification is possible in rational functions to avoid undefined expressions.
Division by zero is a critical concept that leads to undefined function values and must be handled carefully in function analysis.
Transcripts
Browse More Related Video
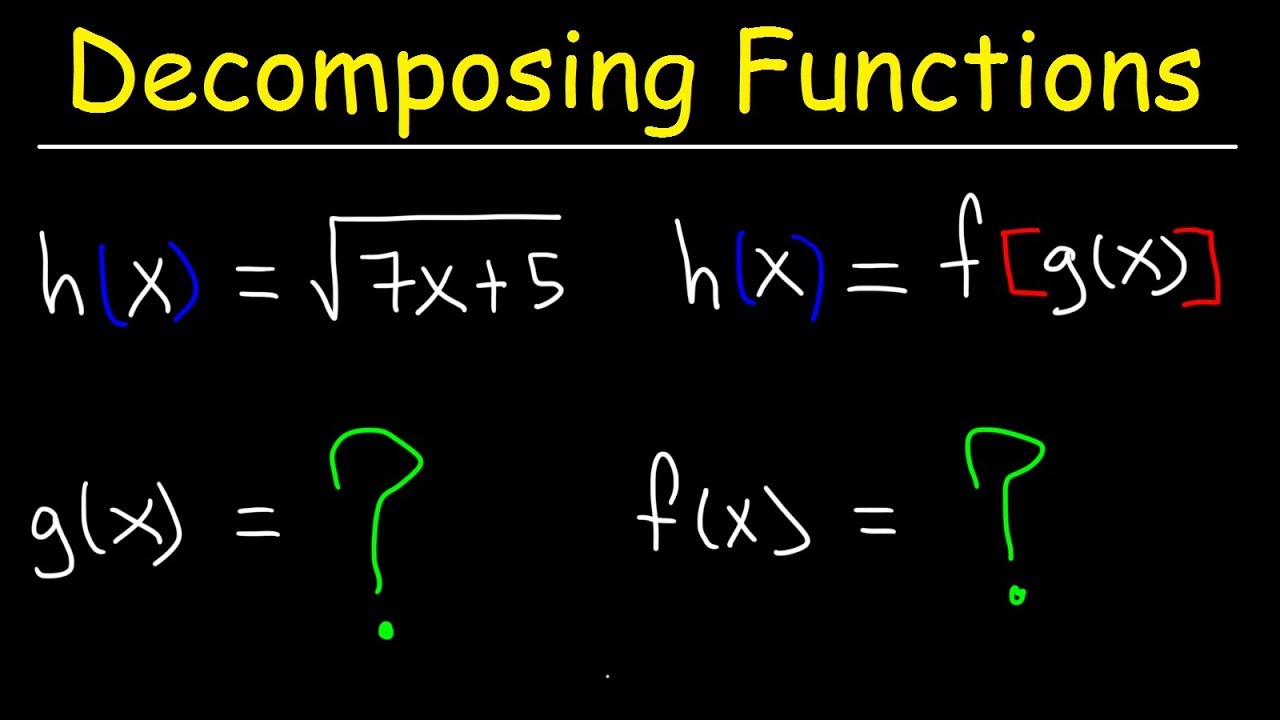
Decomposing Functions - Composition of Functions
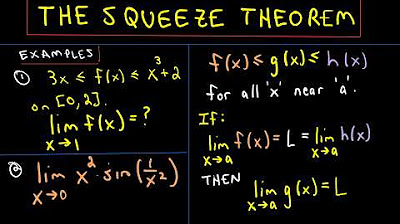
The Squeeze Theorem for Limits, Example 1
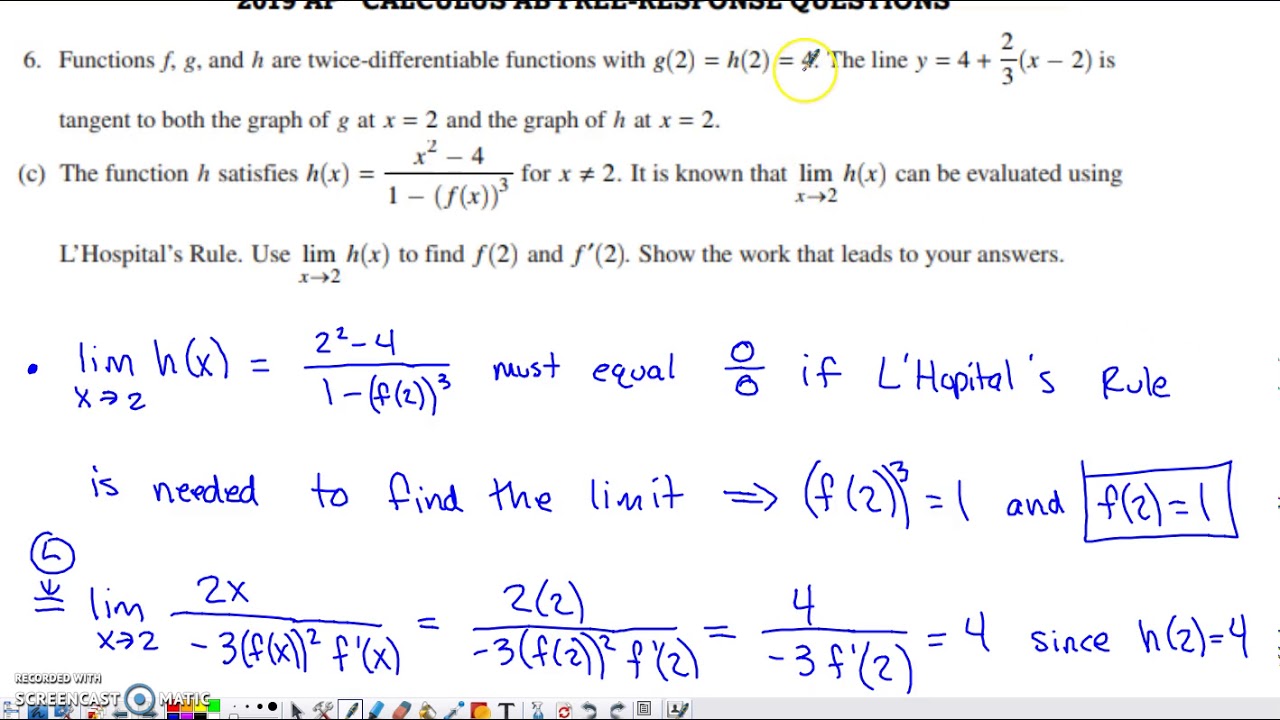
2019 AP Calculus AB Free Response Question #6
Introduction to limits | Limits | Differential Calculus | Khan Academy
A Tale of Three Functions | Intro to Limits Part II
Derivatives of inverse functions: from table | AP Calculus AB | Khan Academy
5.0 / 5 (0 votes)
Thanks for rating: