AP Physics Workbook 6.H Period and Mass Relationship for Mass Spring Systems
TLDRThe video script discusses a segment from an AP Physics workbook focusing on simple harmonic motion, particularly the relationship between mass and the period of a mass-spring system. It explains the importance of consistent initial conditions for accurate experimental results and introduces the formula for the period of a mass on a string and a spring-mass system. The video demonstrates how to graph T^2 versus mass using Excel and draw a line of best fit to determine the mass of an object with a given period. It also shows how to calculate the spring constant using the slope of the graph and discusses the implications of a steeper slope on the mass required for a specific period. The content is educational, engaging, and provides a clear walkthrough of the physics concepts involved.
Takeaways
- 📝 The video discusses the relationship between mass and period in a simple harmonic motion experiment using a mass-spring system.
- 🔍 Students should ensure that the object's initial state is consistent across trials to avoid affecting experimental results.
- 📊 The period of a mass on a string is independent of the initial angle displacement for small angles, relying only on the length of the string.
- 📈 The formula for the period of a mass-spring system is derived from the mass and the spring constant, and is also related to the length and gravitational force.
- 🎥 The video demonstrates how to graph T^2 (period squared) versus mass using data and Excel to create a scatter plot.
- 🤔 A line of best fit is drawn on the graph, with the aim of evenly distributing data points above and below the line to minimize residuals.
- 🧠 The mass of an unknown object can be calculated using the line of best fit, given its period of oscillation.
- 📐 The spring constant can be determined from the slope of the line of best fit, using the formula and the known values of PI and the slope.
- 🔄 A steeper slope in the T^2 vs. mass graph indicates a stiffer spring, as it requires less mass for the same period squared value.
- 🔧 The experiment's outcome is sensitive to the slope of the graph, with changes in slope affecting the calculated mass for a given period.
- 📋 The video provides detailed notes and explanations for each step, ensuring that viewers can follow along and understand the principles behind the calculations.
Q & A
What is the topic of the video?
-The topic of the video is about simple harmonic motion in the context of AP Physics, specifically focusing on the relationship between mass and the period of a mass-spring system.
Why does the teacher inform the student that their experimental results will not be evaluated?
-The teacher informs the student that their experimental results will not be evaluated because the student did not ensure that the object had the same attitude in each trial, which is crucial for obtaining accurate and consistent results.
What is the formula for the period of a mass on a string?
-The formula for the period of a mass on a string is not explicitly given in the script, but it is implied that it depends on the length of the string and is independent of the initial angle displacement for small angles.
How is the period of a mass-spring system related to its mass and spring constant?
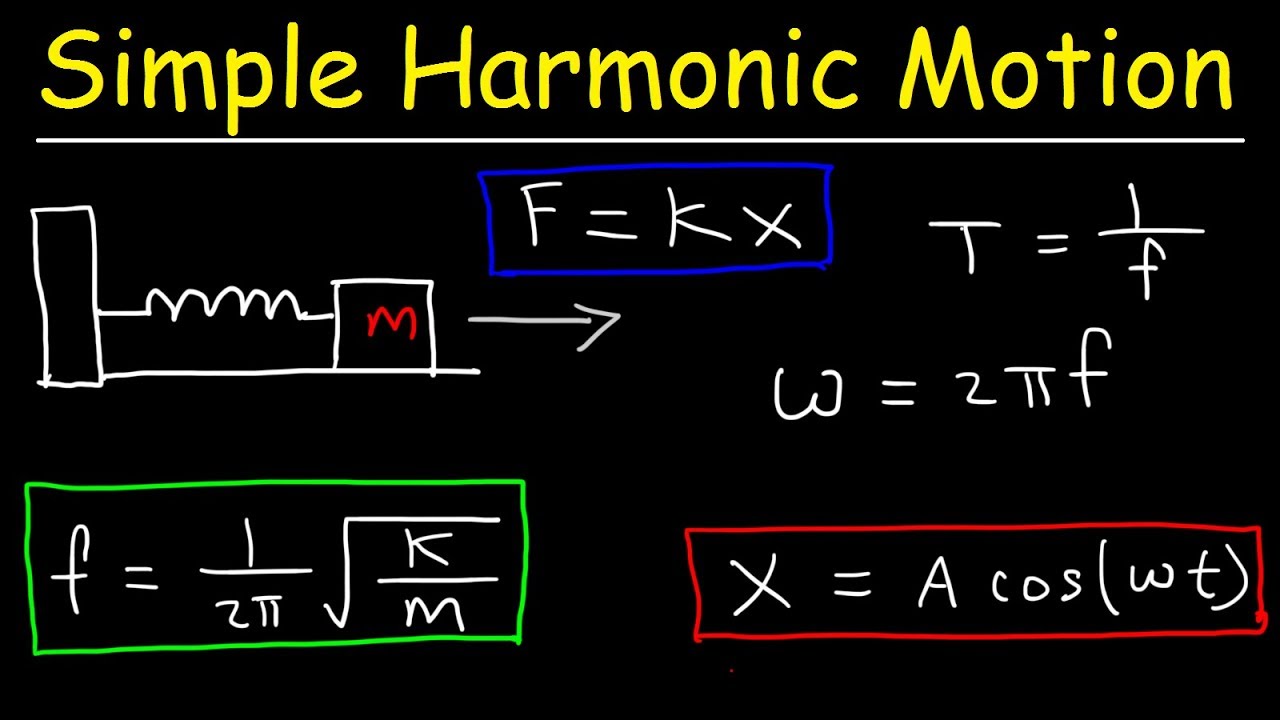
-The period of a mass-spring system is related to its mass and spring constant by the formula T = 2π√(m/k), where T is the period, m is the mass, and k is the spring constant.
What does the video demonstrate about graphing T squared versus mass (M)?
-The video demonstrates how to graph T squared versus mass (M) using data from an experiment, and how to draw a line of best fit to analyze the relationship between these two variables.
How can you determine the mass of an object with a given period using the line of best fit?
-To determine the mass of an object with a given period using the line of best fit, you find the point on the graph where the T squared value corresponds to the given period, and then use the y-intercept of the line to find the mass.
How does the slope of the T squared versus mass graph relate to the spring constant (k)?
-The slope of the T squared versus mass graph is equal to 4π^2/k. Therefore, a steeper slope indicates a smaller spring constant, and a shallower slope indicates a larger spring constant.
What happens to the required mass for a given period if the slope of the T squared versus mass graph becomes steeper?
-If the slope of the T squared versus mass graph becomes steeper, less mass is required for a given period. This is because the slope is inversely proportional to the square root of the mass, as indicated by the formula for the slope.
How can you calculate the spring constant (k) using the slope of the T squared versus mass graph?
-You can calculate the spring constant (k) by rearranging the formula for the slope to solve for k: k = 4π^2 / slope. By substituting the calculated slope value into this formula, you obtain the spring constant.
What is the significance of the initial angle displacement in the context of the pendulum model?
-For small initial angle displacements in the pendulum model, the frequency and period of the pendulum are independent of the angle. This simplifies the analysis and allows for the assumption that the motion is simple harmonic.
What is the role of Excel in this physics experiment?
-Excel is used in the experiment to organize and plot data points, specifically mass and T squared values. It facilitates the creation of a scatter plot, which is then used to draw the line of best fit and analyze the relationship between mass and period.
Outlines
📚 Introduction to AP Physics: Simple Harmonic Motion
This paragraph introduces the topic of the video, which is focused on AP Physics, specifically addressing the concept of simple harmonic motion as covered in Unit 6, Section 6.1. The scenario involves a student's experimental oversight where they did not ensure that the object had the same aptitude in each trial. The teacher clarifies that this oversight will impact the evaluation of their experimental results. The paragraph also introduces the formula for the period of a mass-spring system and explains the two versions of the formula depending on whether the system is a mass on a string or a mass on a spring. The importance of understanding the relationship between the mass, spring constant, and period is emphasized.
📈 Data Analysis and Graphing in Excel
In this paragraph, the focus shifts to data analysis and graphing techniques using Excel. The task involves graphing the period squared (T^2) versus mass (M) and drawing a line of best fit. The video provides a step-by-step guide on how to input the mass and T^2 values into an Excel spreadsheet, create a scatter plot, and draw the line of best fit. The concept of residuals and ensuring that the line of best fit has an equal number of points above and below it is discussed, which is crucial for accurate data analysis. The paragraph also explains how to calculate the spring constant (K) using the slope of the line and the formula derived from the data points.
🔍 Interpreting Results and Calculating Unknown Mass
This paragraph delves into the interpretation of the graph and the calculation of an unknown mass based on the period of oscillation. The video demonstrates how to use the line of best fit to determine the mass of an object with a given period. It explains the process of squaring the period value and finding the corresponding mass on the graph. The paragraph also discusses the impact of a steeper slope on the graph, which indicates a stiffer spring constant (K). The change in slope affects the required mass for a given period, with a steeper slope necessitating less mass. The video concludes with a comprehensive overview of the solutions and notes provided, reinforcing the key concepts and calculations discussed.
Mindmap
Keywords
💡Simple Harmonic Motion
💡Period
💡Mass-Spring System
💡Spring Constant
💡Graphing
💡Line of Best Fit
💡Excel
💡Residuals
💡Slope
💡Stewart
💡Aptitude
Highlights
The scenario involves a mass-spring system and its relationship with simple harmonic motion.
The student's experimental results were affected by not ensuring the object had the same attitude in each trial.
The formula for the period of a mass on a string is introduced and its dependence on the length of the string is discussed.
For small angles, the frequency and period of a pendulum are independent of the initial angle displacement.
The formula for the period of a spring-mass system is provided, highlighting its dependence on mass and spring constant.
Excel is used to graph T squared versus mass, with a scatter plot being the chosen method.
A line of best fit is drawn, with the aim of evenly distributing data points above and below the line to minimize residuals.
Using the line of best fit, the mass of an object with a known period can be calculated.
The spring constant can be determined from the slope of the T squared versus mass graph, using the slope equation.
A steeper slope in the T squared versus mass graph indicates a stiffer spring, as it requires less mass for the same period.
The concept of residual minimization is explained in the context of drawing a line of best fit for AP Stats students.
The video provides a step-by-step guide on how to perform the calculations and graphing necessary for solving the problem.
The importance of understanding the relationship between the mass, spring constant, and period in a spring-mass system is emphasized.
The video concludes with a comprehensive summary of the problem-solving process and the key formulas used.
Transcripts
Browse More Related Video
AP Physics Workbook 6.L Sine function of SHM
AP Physics Workbook 6.I Changing Mass and Period of a Mass Spring SYstem
How To Solve Simple Harmonic Motion Problems In Physics

AP Physics 1 review of Waves and Harmonic motion | Physics | Khan Academy

Simple Harmonic Motion - Springs in series vs parallel, and vertical springs
AP Physics Workbook 6.C Equations of Motion for Simple Harmonic Motion
5.0 / 5 (0 votes)
Thanks for rating: