Sample vs Population - Clearly Explained
TLDRThis video tutorial elucidates the fundamental concepts of a sample and a population in statistics. Using the example of a hypothetical Disease X, it explains how a sample, a smaller group selected randomly, is used to infer conclusions about a larger population. It further discusses how the measured statistic from a sample, such as average life expectancy, may differ from the actual parameter of the population due to sampling error and selection bias, highlighting the challenges in achieving a representative sample.
Takeaways
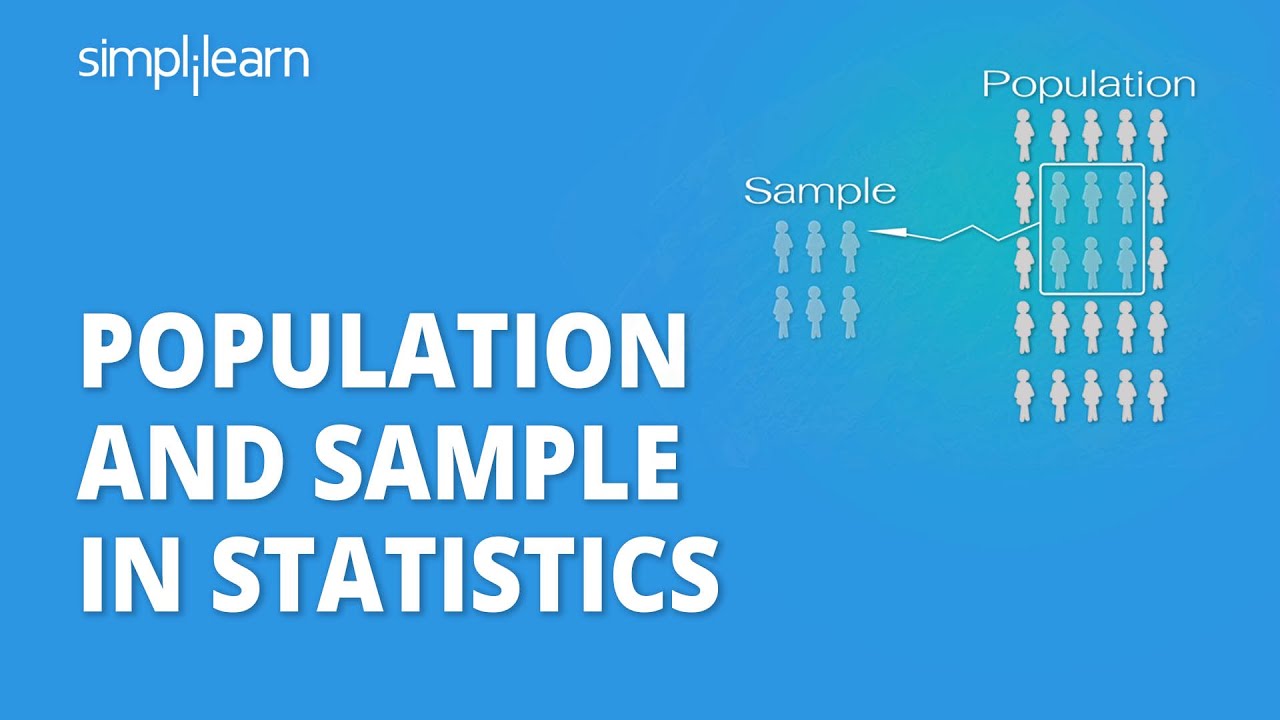
- 🔍 A population in statistics refers to the entire group of individuals or observations that are the subject of a study.
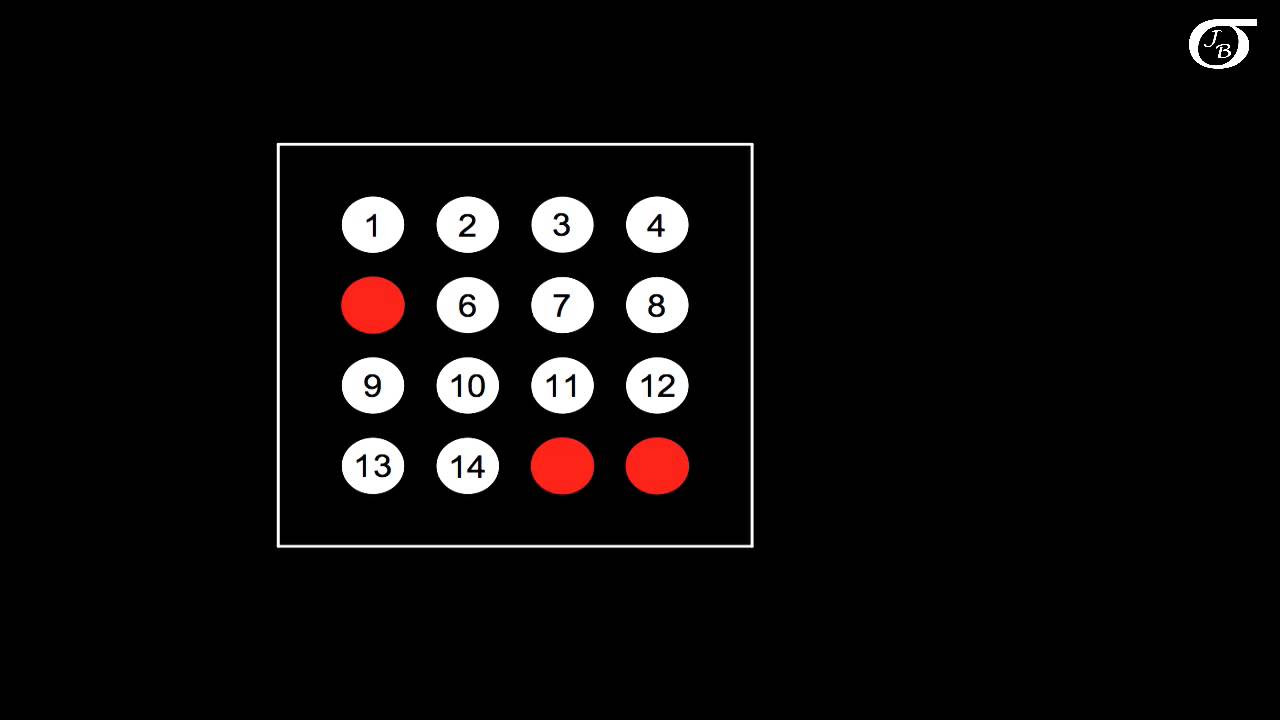
- 🔎 A sample is a smaller, representative subset of the population selected for analysis.
- 🌐 The population for the hypothetical Disease X example includes all individuals worldwide affected by the disease.
- 🎯 The purpose of using a sample is to make inferences and draw conclusions about the larger population when it's impractical to study everyone.
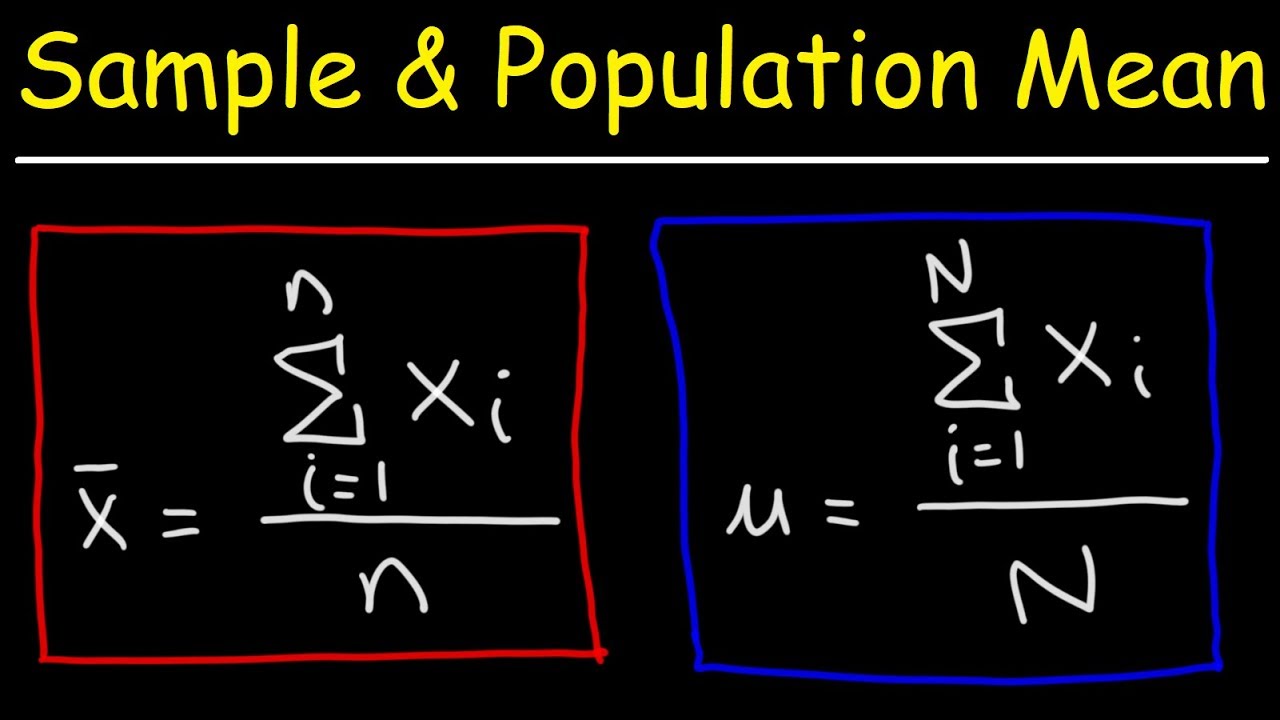
- 📊 A statistic is a measure obtained from a sample, such as the average life expectancy of individuals with Disease X in the example.
- μ The parameter is a measure obtained from the entire population, symbolized by mu, like the true average life expectancy of all individuals with Disease X.
- ⚖️ Differences between a sample statistic and a population parameter can arise due to sampling error and selection bias.
- 🤔 Sampling error occurs when a sample's characteristics differ from the population by chance, potentially skewing results.
- 📋 Selection bias happens when the sample is not chosen randomly, leading to a non-representative group, such as only recruiting Facebook users.
- 🔄 Despite potential discrepancies, the goal is to use the sample to make generalizations about the population's characteristics.
- 👍 The video aims to clarify the concepts of samples and populations and their roles in statistical analysis and inference.
Q & A
What are the two key terms introduced in the script related to statistics?
-The two key terms introduced are 'sample' and 'population'.
What is the definition of a population in statistics?
-A population in statistics refers to the entire group of individuals or objects that are being studied, such as every person in the world with a specific disease.
What is a sample in the context of statistical analysis?
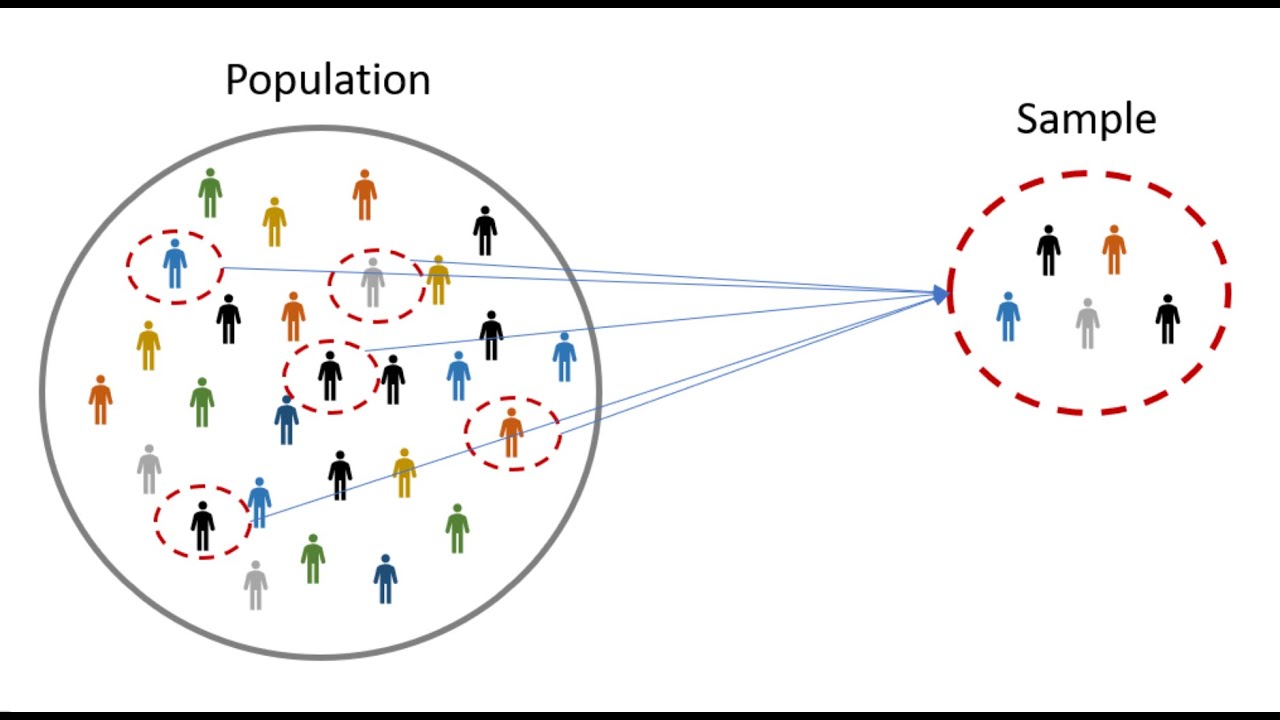
-A sample is a smaller, randomly selected subset of individuals or objects taken from a larger population for the purpose of study and analysis.
Why is it impractical to study an entire population in statistics?
-It is impractical because it would be extremely difficult or almost impossible to recruit every member of the population, due to factors like refusal to participate or geographical constraints.
What is the purpose of using a sample to make conclusions about a population?
-The purpose of using a sample is to obtain a representative subset that can be used to infer characteristics or trends about the larger population when it is not feasible to study the entire population.
What is a statistic in the context of the script?
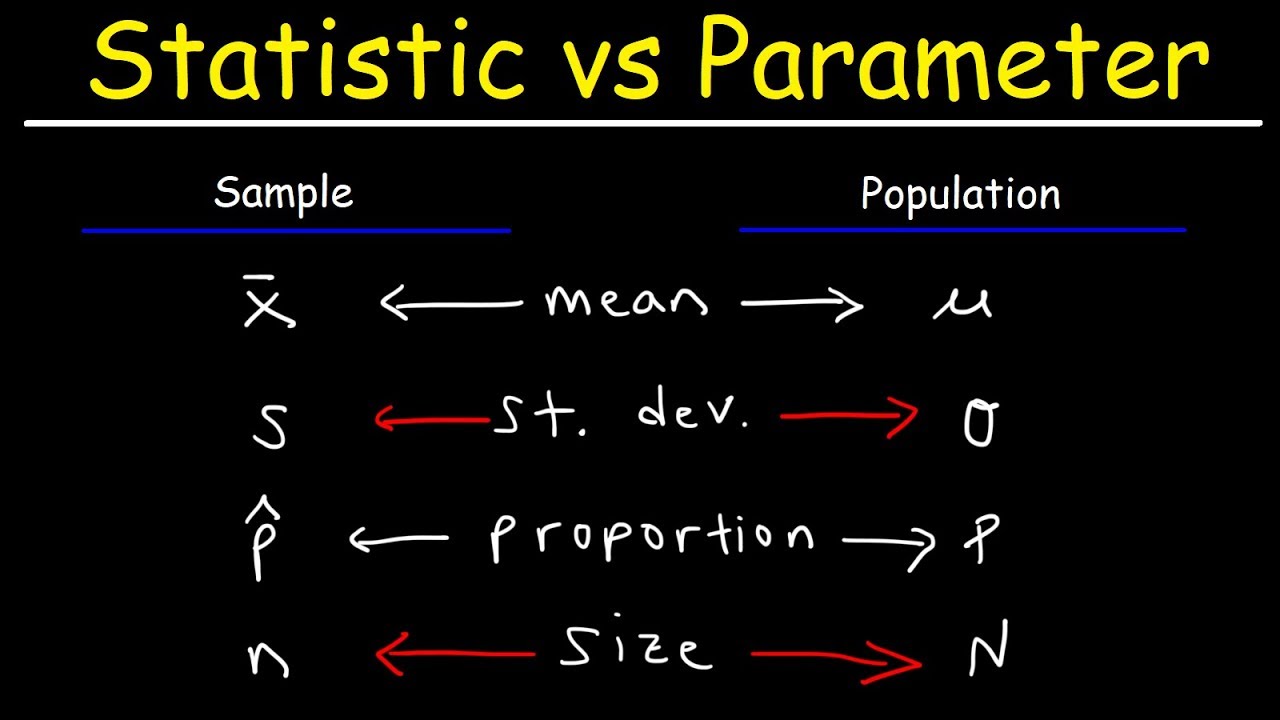
-A statistic is a measure, such as the average life expectancy, obtained from a sample and is denoted by the mean symbol x-bar.
What is a parameter in statistics?
-A parameter is a measure obtained from the entire population, such as the true average life expectancy, and is denoted by the mean symbol mu (μ).
Why might the value of a statistic differ from the value of a parameter?
-The difference can arise due to sampling error, where the sample has different characteristics by chance, or selection bias, where the sample is not truly randomly selected.
What is sampling error and how does it occur?
-Sampling error occurs when the sample, by chance, has different characteristics than the population, leading to results that may not accurately represent the population.
What is selection bias and how does it happen?
-Selection bias happens when the sample is not selected in a truly random fashion, leading to certain individuals being preferentially recruited, which can skew the results.
How can we potentially reduce sampling error and selection bias?
-We can reduce these by ensuring that the sample is randomly selected and representative of the population, and by using appropriate sampling techniques to minimize the chance of obtaining a sample that does not accurately reflect the population.
Outlines
📊 Introduction to Sample and Population
This paragraph introduces the fundamental concepts of a sample and a population in statistics. It explains that a population consists of all individuals or items of interest, while a sample is a smaller subset drawn from this population. The example given involves a hypothetical disease, Disease X, affecting over a million people worldwide. The paragraph clarifies that it is impractical to study every individual with the disease, hence the need for a sample. The process of drawing a sample aims to make generalizations about the population, with the understanding that there may be discrepancies between the sample's findings (statistic) and the population's actual characteristics (parameter) due to factors like sampling error and selection bias.
Mindmap
Keywords
💡Statistics
💡Sample
💡Population
💡Experiment
💡Random Selection
💡Statistic
💡Parameter
💡Sampling Error
💡Selection Bias
💡Life Expectancy
💡Generalization
Highlights
The introduction of basic statistical terms: sample and population.
Using a disease (Disease X) as an example to explain these terms.
The population defined as every person in the world with Disease X.
The impracticality of recruiting the entire global population for a study.
The concept of a sample as a smaller, randomly selected group from the population.
The purpose of a sample: to make general conclusions about the larger population.
The calculation of life expectancy in the sample and its representation as a statistic (x-bar).
The hypothetical average life expectancy of the population (mu) and its comparison to the sample.
Explaining the discrepancy between sample statistics and population parameters due to various factors.
The definition and example of sampling error affecting the results.
The concept of selection bias and how it can skew sample representation.
The impact of social media recruitment on study inclusivity and potential bias.
The importance of understanding the difference between a sample and a population in statistical analysis.
The role of random selection in obtaining a representative sample.
The video's call to action for likes, comments, and subscriptions for further educational content.
Transcripts
Browse More Related Video
Population And Sample In Statistics Example | Population vs Sample In Statistics | Simplilearn
Statistics: Populations & Samples and Parameters vs Statistics
Populations, Samples, Parameters, and Statistics
Statistic vs Parameter & Population vs Sample
Sample Mean and Population Mean - Statistics
Sampling Distributions: Introduction to the Concept
5.0 / 5 (0 votes)
Thanks for rating: