Stats: Finding Probability Using a Normal Distribution Table
TLDRThe video script explains the process of using a standard normal distribution table to find probabilities related to Z-scores. It illustrates how to interpret the table, understand the meaning of shading to the left or right of the mean, and calculate probabilities for scenarios such as finding the probability that Z is less than a specific value, greater than a value, or between two values. The explanation is clear, focusing on visual understanding and practical application of statistical concepts.
Takeaways
- 📊 Understanding probability involves recognizing it as an area under the standard normal distribution curve.
- 📈 The total area under the standard normal distribution curve equals one, representing 100% of all possible outcomes.
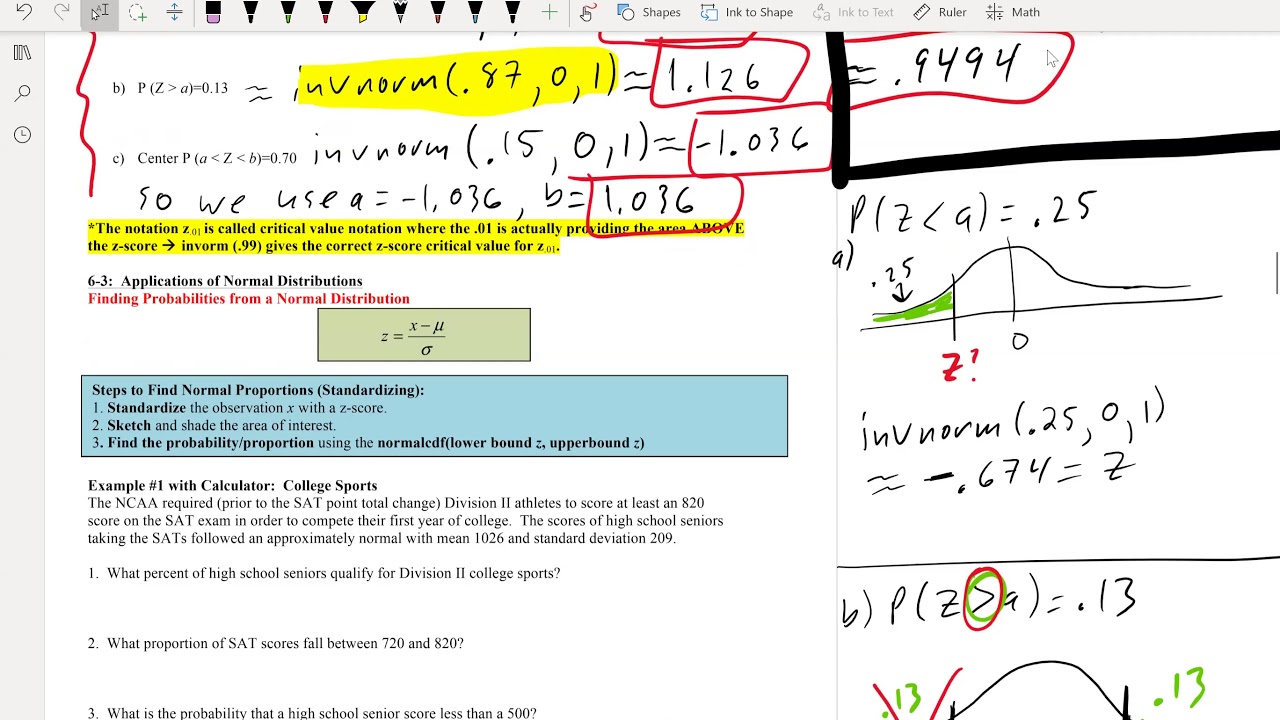
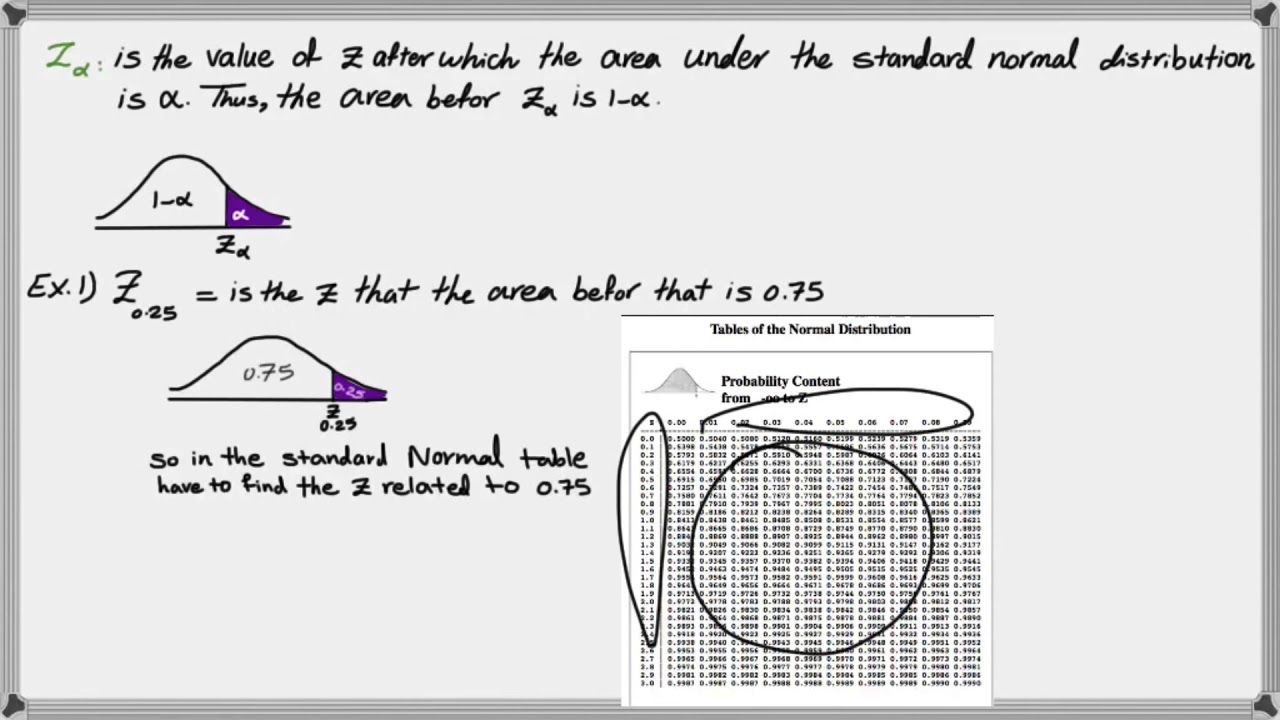
- 🔍 To find a specific probability, one must use a standard normal distribution table, which requires knowledge of the Z-score.
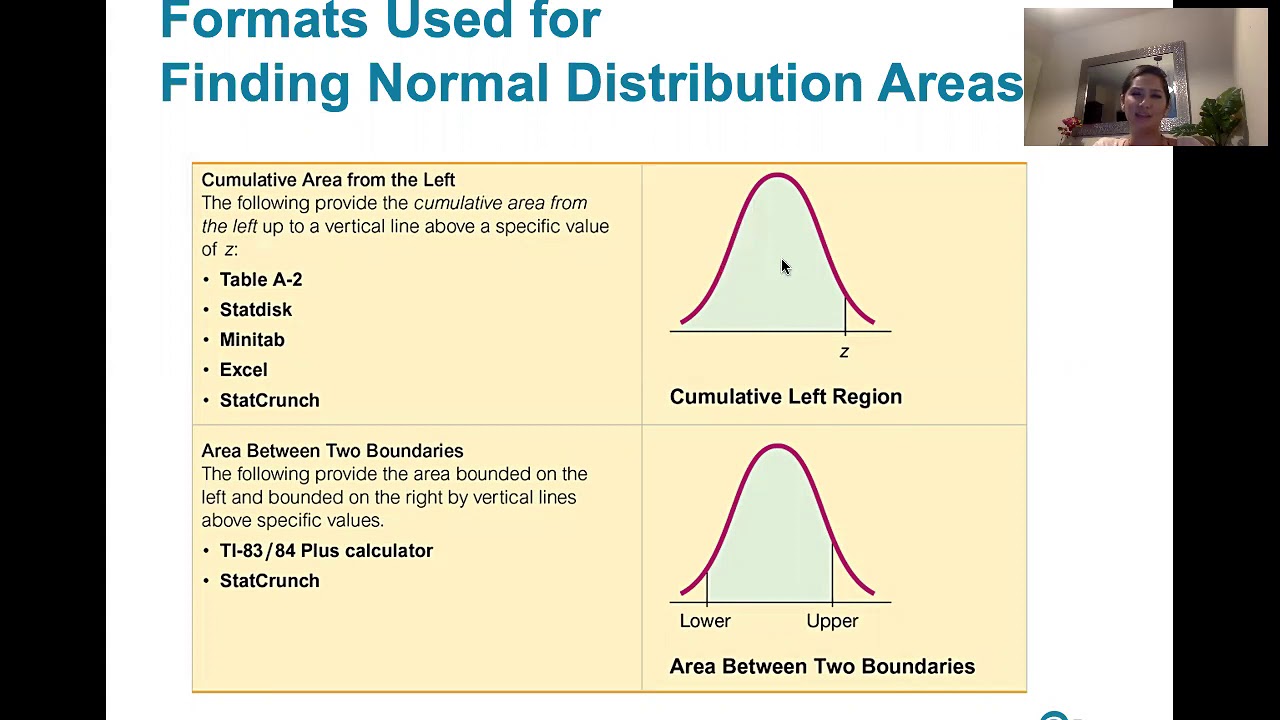
- 📚 Different books may present the standard normal table differently, so it's crucial to pay attention to the shading and layout of the table.
- 🤔 When looking for a probability that Z is less than a certain value, the table is used to find the area to the left of that Z-score.
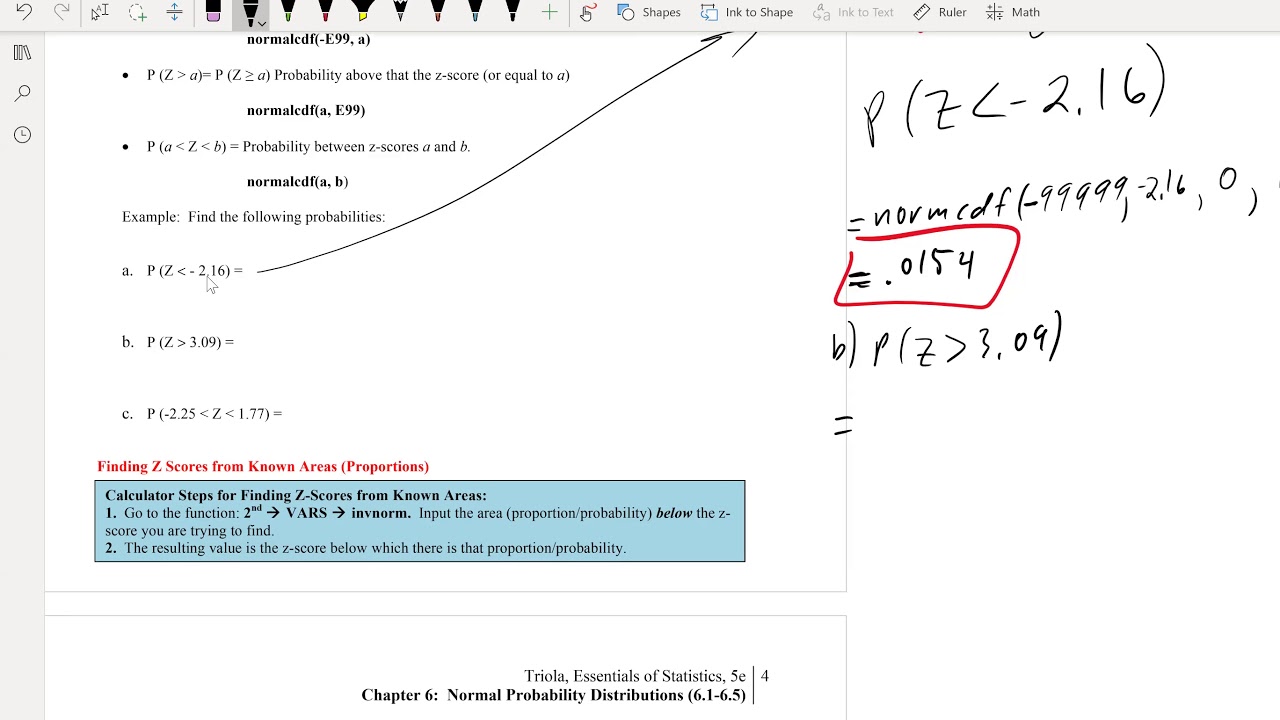
- 🎯 For a probability that Z is greater than a certain value, the complement rule is applied by subtracting the left-sided probability from one.
- 🔢 The complement rule states that the probability of an event not occurring is one minus the probability of it occurring.
- 🌟 For finding the probability between two Z-scores, subtract the area corresponding to the smaller Z-score from the area corresponding to the larger Z-score.
- 📝 When working with probabilities, it's common to round off the results to four decimal places, especially in digital platforms like MyMathLab.
- 📊 Visual aids, such as diagrams and shading, are essential in understanding and explaining the concept of probability in the context of the normal distribution.
Q & A
What is the total area under a standard normal distribution curve?
-The total area under a standard normal distribution curve is equal to one.
What does a probability value represent in the context of the normal distribution?
-A probability value represents the area under the normal distribution curve, which corresponds to the likelihood of a specific event or outcome.
How can you find the probability that Z is less than a given value using a standard normal distribution table?
-You can find the probability that Z is less than a given value by locating the value on the table, which corresponds to the area to the left of that value in the standard normal distribution.
What is the significance of the mean in a standard normal distribution?
-In a standard normal distribution, the mean is located at the center of the distribution, and everything to the right of 0 is positive while everything to the left is negative.
How do you interpret a negative z-score in the context of the normal distribution?
-A negative z-score indicates a value that is below the mean in the normal distribution, and it corresponds to the area to the left of the z-score on the number line.
What is the probability that Z is greater than a negative value according to the standard normal distribution table?
-The probability that Z is greater than a negative value is found by taking the complement of the area to the left of that value, which is calculated as 1 minus the given probability from the table.
How can you calculate the probability of a range of z-scores in the normal distribution?
-To calculate the probability of a range of z-scores, you find the probabilities for the two endpoints of the range using the standard normal distribution table and then subtract the smaller probability from the larger one.
What does the shading to the left in a standard normal distribution table represent?
-The shading to the left in a standard normal distribution table represents the area under the curve to the left of the given z-score, which is used to find probabilities for values less than the z-score.
How can you visually represent the concept of probability in the normal distribution?
-You can visually represent the concept of probability in the normal distribution by shading the area under the curve that corresponds to the likelihood of a certain event or outcome.
What is the significance of the decimal 0.0934 in the context of the normal distribution?
-The decimal 0.0934 represents the probability that the standard normal variable Z is less than negative 1.32, which corresponds to the area under the curve to the left of that z-score.
How would you describe the process of finding probabilities using a standard normal distribution table?
-The process involves identifying the z-score of interest, using the table to find the corresponding area under the curve, and then interpreting this area as the probability for the given range of values.
Outlines
📊 Understanding the Standard Normal Distribution Table
This paragraph introduces the concept of using a standard normal distribution table to find probabilities. It explains that probability is an area under the bell-shaped curve of the standard normal distribution and that this area is always less than one. The speaker emphasizes the importance of understanding the table's structure and visual representation, particularly the shading which indicates the area of interest. The example given involves finding the probability that a Z-score is less than negative 1.30, and the speaker demonstrates how to look up this value in the table, arriving at a probability of 0.0934.
🔢 Interpreting Probabilities as Percentages
The second paragraph delves into interpreting the probabilities obtained from the standard normal distribution table as percentages. It continues the discussion from the previous example, explaining that a probability of 0.0934 corresponds to approximately 9.34%. The speaker then changes the problem to find the probability that a Z-score is greater than negative 1.32, explaining that this requires shading to the right of the mean and finding the complement of the previously found area. The speaker calculates this as 1 - 0.0934, resulting in a probability of 0.9066, or approximately 90.66%.
📈 Finding Probabilities Between Two Z-Scores
The final paragraph discusses how to find the probability between two Z-scores using the standard normal distribution table. The speaker provides an example of finding the probability between negative 0.21 and 0.85 Z-scores. It explains the process of looking up each Z-score in the table and understanding the areas they represent. The speaker then demonstrates how to calculate the area between the two Z-scores by subtracting the smaller area from the larger one, resulting in a probability of 0.3855, or 38.55% when rounded to four decimal places.
Mindmap
Keywords
💡Standard Normal Distribution
💡Z-score
💡Probability
💡Normal Distribution Table
💡Total Area Under the Curve
💡Less Than (<) Symbol
💡Greater Than (>) Symbol
💡Complement Rule
💡Shading on the Graph
💡Between Two Values
💡Decimal Places
Highlights
The video explains how to use a standard normal distribution table to find probabilities.
The total area under a standard normal distribution curve equals one.
Probability in the context of the normal distribution represents an area under the curve.
Different books may present the standard normal table differently, so it's important to understand the table's structure.
The video demonstrates how to find the probability that Z is less than negative one point thirty two.
When looking for a value less than a given Z-score, the shading is done to the left of the Z-score on the number line.
The probability found corresponds to the area under the curve to the left of the given Z-score.
For the problem of finding the probability that Z is greater than a value, the shading is done to the right of the Z-score.
To find the probability for a greater than scenario, you calculate the complement of the probability found in the table.
The complement of a probability is found by subtracting the table value from 1.
When finding the probability between two Z-scores, you look up each score and calculate the difference between the probabilities.
The area between two Z-scores is found by subtracting the smaller probability from the larger one.
The video emphasizes the importance of visual understanding when working with normal distribution tables.
The process shown in the video can be applied to various statistical problems involving normal distributions.
The video provides a practical guide to using normal distribution tables for solving probability problems.
Understanding the meaning of shading to the left or right of the Z-score is crucial for accurate probability calculation.
The video offers a step-by-step approach to finding probabilities using standard normal distribution tables.
Transcripts
Browse More Related Video
Math 119 Chap 6 part 2
6.1.4 The Standard Normal Distribution - Given a range of z scores, find areas or probabilities.
Math 119 Chap 6 part 1
Z-statistics vs. T-statistics | Inferential statistics | Probability and Statistics | Khan Academy
How to find critical Z value (Z alpha)
Probabilities from density curves | Random variables | AP Statistics | Khan Academy
5.0 / 5 (0 votes)
Thanks for rating: