Biased and unbiased estimators from sampling distributions examples
TLDRThe video script discusses the concept of unbiased estimators in statistics, using the example of estimating a population median with a sample median. It explains that an unbiased estimator has a sampling distribution centered around the true population parameter. The script uses a scenario with ping pong balls to illustrate this, showing that a sample median of five balls, taken multiple times, forms a sampling distribution that appears unbiased when roughly balanced around the population median of 16. Further examples compare different estimators for a population parameter, highlighting that the estimator with both low bias and low variability is the most desirable.
Takeaways
- 📊 The concept of an unbiased estimator was discussed, emphasizing the importance of the sampling distribution being evenly distributed around the true population parameter.
- 🎱 The example of estimating the population median using ping pong balls numbered from zero to 32 was provided, with the true population median being 16.
- 🔄 A random sample of five balls was taken and replaced for a total of 50 trials to simulate the sampling process and calculate the sample median.
- 📈 The dotplot was used to visualize the sampling distribution of the sample median, showing 50 data points representing the median of each sample.
- 🔢 The sampling distribution for the sample median was analyzed, noting that it should be balanced around the population median to be considered unbiased.
- 🤔 The question of whether the sample median is a biased or unbiased estimator was posed, prompting viewers to consider the characteristics of the sampling distribution.
- 🏁 Two scenarios were described where the sampling distribution would indicate bias: if it consistently underestimated (to the left) or overestimated (to the right) the true parameter.
- 📊 Another example was given with three different estimators approximating the sampling distribution for a population parameter of five, aiming to identify which estimator had both low bias and low variability.
- 🔎 The analysis of the three estimators revealed that Statistic C was clearly biased as its distribution was consistently to the left of the true parameter.
- 🏆 It was concluded that Statistic A, with a relatively low spread and reasonable balance around the true parameter, was the estimator with both low bias and low variability.
Q & A
What is an unbiased estimator in statistics?
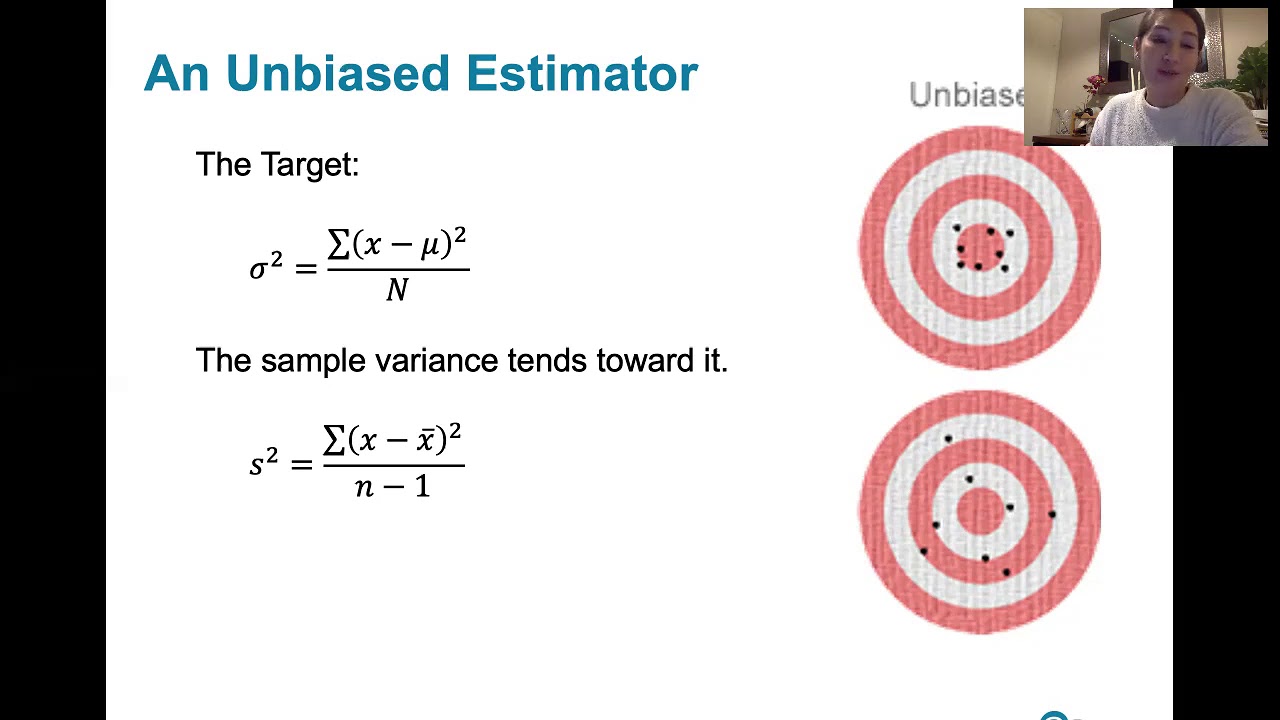
-An unbiased estimator is a statistic that has a sampling distribution with a mean equal to the true value of the parameter being estimated. Essentially, an unbiased estimator does not systematically overestimate or underestimate the true parameter of the population.
What was the population median in the given example?
-The population median in the given example is 16. This is the value that separates the higher half from the lower half of the data when the population is ordered from least to greatest.
How many balls did Alejandro sample in his experiment?
-Alejandro sampled five balls in each trial of his experiment.
How many trials did Alejandro conduct in total?
-Alejandro conducted a total of 50 trials in his experiment.
What is the sampling distribution of a statistic?
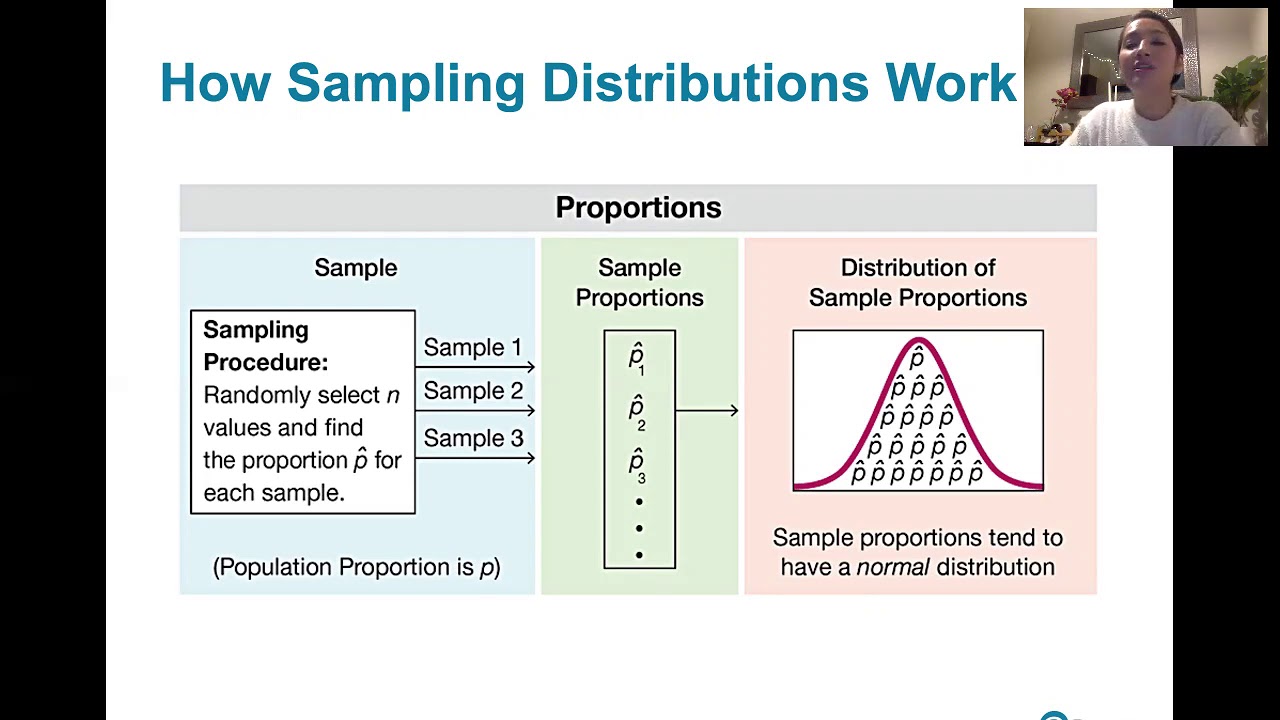
-The sampling distribution of a statistic is the probability distribution of a given statistic based on a random sample of data. It shows how the statistic would vary if you took many samples of the same size from the same population and calculated the statistic for each sample.
How can you determine if a sampling distribution is balanced around the true parameter?
-A sampling distribution is balanced around the true parameter if it is evenly distributed to the left and right of the true parameter value. If the distribution is skewed or consistently leans to one side, it is not balanced and may indicate bias in the estimator.
What is the population parameter that the three different estimators in the dotplots are trying to approximate?
-The population parameter that the three different estimators are trying to approximate is the value five.
How can you identify a biased estimator from a dotplot of a sampling distribution?
-A biased estimator can be identified from a dotplot if the distribution consistently leans to one side of the true parameter value, indicating that the estimator is either consistently underestimating or overestimating the parameter.
Which estimator from the dotplots has both low bias and low variability?
-Based on the dotplots, estimator A has both low bias and low variability. It is reasonably balanced around the true parameter value and has a lower spread compared to estimator B, indicating that it consistently provides estimates closer to the true parameter value.
What does the term 'variability' refer to in the context of statistics?
-In the context of statistics, 'variability' refers to the degree of spread or dispersion in a set of data points or a sampling distribution. Lower variability indicates that the estimator produces values that are more consistently close to the true parameter, while higher variability suggests greater fluctuation and less consistency.
How can you ensure that an estimator is unbiased and has low variability?
-To ensure that an estimator is unbiased and has low variability, one would need to take a large number of samples, calculate the statistic for each sample, and analyze the resulting sampling distribution. The estimator would be unbiased if its sampling distribution is centered around the true parameter value, and it would have low variability if the estimates are consistently close to the true parameter with minimal fluctuation.
Outlines
📊 Analysis of Sample Median as an Unbiased Estimator
The paragraph discusses an experiment conducted by Alejandro to determine if the sample median is an unbiased estimator of the population median. He numbered ping pong balls from zero to 32, mixed them, and drew random samples of five balls, calculating the median of each sample. This process was repeated 50 times, with the results summarized in a dotplot, showing the sampling distribution of the sample median. The known population median is 16, and the distribution of sample medians appears balanced around this value, suggesting that the sample median is an unbiased estimator. The concept of an unbiased estimator is explained, emphasizing that for an estimator to be unbiased, its sampling distribution should be evenly distributed around the true population parameter.
📈 Comparing Estimators for Bias and Variability
This paragraph continues the discussion on statistical estimators by comparing three different estimators, represented by dotplots, to determine which has both low bias and low variability. The population parameter in question is five. It is noted that while all three estimators show some level of bias, estimator C is clearly biased as its sampling distribution is consistently to the left of the true parameter value. Estimators A and B appear to be reasonably unbiased, but the focus then shifts to variability. Estimator A is determined to have lower variability compared to estimator B, as the spread of its sampling distribution around the true parameter is narrower. Therefore, estimator A is identified as having both low bias and low variability, making it the preferred choice among the three.
Mindmap
Keywords
💡unbiased estimator
💡sampling distribution
💡population median
💡sample median
💡dotplot
💡random sample
💡parameter
💡statistic
💡bias
💡variability
💡low bias and low variability
Highlights
Alejandro's inquiry about the unbiased nature of the sample median as an estimator for the population median.
The use of ping pong balls numbered from zero to 32 to simulate a population.
The population median is established as 16.
A random sample of five balls is taken and the median of the sample is calculated.
The process of sampling, calculating the median, and replacing the balls is repeated 50 times.
The sampling distribution of the sample median is visualized through a dotplot.
For an estimator to be unbiased, its sampling distribution must be evenly distributed about the true population parameter.
The sampling distribution is balanced to the left and right of the true median of 16, suggesting the sample median is an unbiased estimator.
An example of a biased estimator is one where the sampling distribution is consistently to the left of the true parameter, underestimating it.
Three different estimators are compared using dotplots to show their sampling distributions.
The population parameter's actual value is given as five.
Statistic C is identified as biased due to its consistent underestimation of the true parameter.
Statistic A and B are considered reasonably unbiased based on their sampling distributions.
Statistic A is determined to have both low bias and low variability compared to statistic B.
The spread of the estimators around the true parameter is used to judge variability, with statistic A showing less spread.
The approximation of the sampling distribution is emphasized as a tool for understanding estimator performance.
The practical application of these concepts is to guide the selection of estimators that are both unbiased and have low variability.
Transcripts
Browse More Related Video
6.3.5 Sampling Distributions and Estimators - Biased and Unbiased Estimators
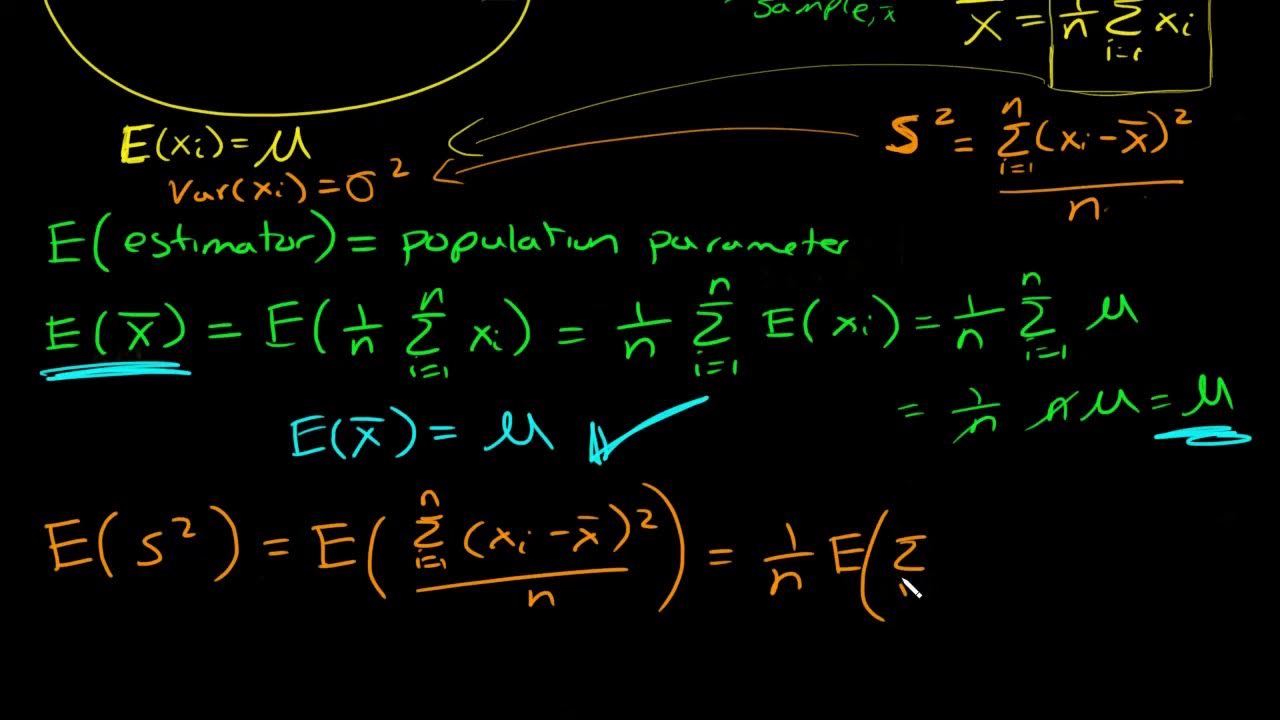
What is an unbiased estimator? Proof sample mean is unbiased and why we divide by n-1 for sample var
6.3.1 Sampling Distributions and Estimators - Sampling Distributions Described and Defined

6.3.4 Sampling Distribution and Estimators - Sampling Distribution of Sample Variance
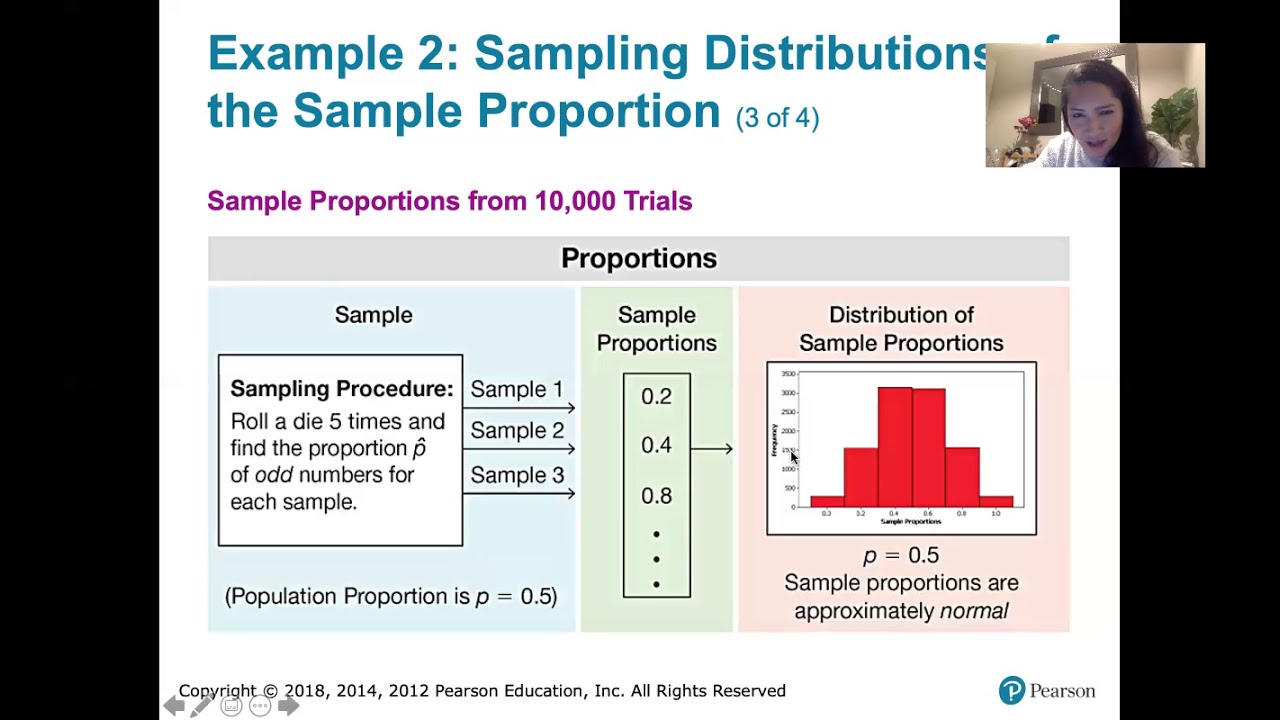
6.3.2 Sampling Distributions and Estimators - Sampling Distribution of Sample Proportions
6.3.3 Sampling Distributions and Estimators - Sampling Distribution of the Sample Means
5.0 / 5 (0 votes)
Thanks for rating: