Lesson 10 - Rejection Regions In Hypothesis Testing (Statistics Tutor)
TLDRIn this lesson on mastering statistics, the focus is on hypothesis testing. The instructor emphasizes the importance of understanding the concepts before diving into problem-solving. The lesson aims to clarify how to use sample data to make an objective decision about a null hypothesis, using the example of manufacturing pencils to illustrate the process. The concept of a confidence interval is introduced as a parallel to hypothesis testing, with the distinction made between handling means with a t-distribution for less than 30 samples and a normal distribution for 30 or more samples. The lesson sets the stage for learning how to determine the threshold for rejecting the null hypothesis, which is crucial for making statistically sound decisions.
Takeaways
- 📚 The lesson focuses on hypothesis testing, a statistical method used to make decisions from data.
- 🔍 Hypothesis testing involves comparing a null hypothesis (no effect or no difference) against an alternative hypothesis (there is an effect or a difference).
- ⚖️ The process aims to determine if there's enough statistical evidence to reject the null hypothesis in favor of the alternative.
- 📉 A practical example is given regarding the average length of pencils to illustrate the concept of hypothesis testing.
- 🔑 The concept of a 'confidence interval' is introduced as a parallel to hypothesis testing, which helps in understanding the statistical approach.
- 📊 For means, the choice of statistical distribution (t-distribution for small samples, normal distribution for larger samples) is based on the sample size.
- 📈 The normal distribution is used for confidence intervals of proportions, while the chi-square distribution is used for variance or standard deviation.
- 🛠️ The lesson emphasizes the importance of understanding the underlying concepts before moving on to solving real statistical problems.
- ⏰ The instructor reassures that real problems will be tackled in the next lesson, after ensuring a solid conceptual foundation.
- 📍 The key challenge in hypothesis testing is determining the threshold or 'hurdle' that, if crossed, leads to the rejection of the null hypothesis.
- 🔬 The course material is applicable to the next 10 to 15 lessons, highlighting the importance of grasping the fundamentals for future topics.
- 💡 The goal is to use sample data to make inferences about a larger population, which is a fundamental principle in statistics.
Q & A
What is the main focus of this lesson?
-The main focus of this lesson is to understand the conceptual aspects of hypothesis testing, particularly how to mechanize the process of rejecting or failing to reject a null hypothesis using sample data.
What are the two types of hypotheses typically involved in hypothesis testing?
-The two types of hypotheses are the null hypothesis and the alternative (or research) hypothesis.
Why is it important to understand the process of hypothesis testing before solving real problems?
-Understanding the process before solving real problems helps to ensure a solid foundation and makes it easier to apply the concepts in more complex scenarios later on.
What is an example given in the transcript to illustrate the need for hypothesis testing?
-The example given is about manufacturing pencils where there is a claim that the pencils are longer on average than they should be, and the need to determine if this claim is statistically significant.
How does the concept of confidence intervals relate to hypothesis testing?
-Confidence intervals and hypothesis testing are similar in that they both use statistical distributions (like the t-distribution, normal distribution, or chi-square distribution) to make inferences from sample data to the larger population.
What is the purpose of drawing a line in hypothesis testing?
-The purpose of drawing a line, or setting a threshold, is to determine at what point the observed data is statistically significant enough to reject the null hypothesis.
What is the significance of the number 30 in the context of confidence intervals?
-The number 30 is a common rule of thumb where, if the sample size is less than 30, a t-distribution is used as an approximation to the normal distribution for confidence intervals of means. If the sample size is 30 or more, the normal distribution is used.
How does the concept of a 'hurdle' relate to hypothesis testing?
-In hypothesis testing, the 'hurdle' refers to the critical value or threshold that the test statistic must exceed in order to reject the null hypothesis.
What is the null hypothesis typically set to be in a hypothesis test?
-The null hypothesis is typically set to represent the status quo or the assumption of no effect/difference, which is what the researcher is trying to reject in favor of the alternative hypothesis.
Why is it suggested to take a slower approach at the beginning of learning hypothesis testing?
-A slower approach helps to ensure a deeper and more thorough understanding of the foundational concepts, which will be applicable in more advanced stages of the course and in real-world statistical analysis.
What is the promise made to the learners regarding the next lesson?
-The promise is that in the next lesson, the learners will start working on real problems to apply the concepts of hypothesis testing they have been learning.
What is the general procedure when a claim is made about a product, such as the length of pencils?
-The general procedure involves collecting a sample of the product (e.g., 20 pencils), measuring the attribute in question (pencil length), calculating the average, and then using hypothesis testing to determine if the observed average length is significantly different from the expected length.
Outlines
📚 Introduction to Hypothesis Testing
The video script introduces the topic of hypothesis testing, emphasizing the importance of understanding the concept before diving into problem-solving. The instructor assures the audience that practical problem-solving will be covered in the next lesson. The focus is on the null hypothesis and the alternative hypothesis, and how to use sample data to make an objective decision on whether to reject or fail to reject the null hypothesis. An example involving the manufacturing of pencils is used to illustrate the concept of determining when a deviation from the norm is significant enough to reject the null hypothesis.
Mindmap
Keywords
💡Hypothesis Testing
💡Null Hypothesis
💡Alternative Hypothesis
💡Confidence Intervals
💡T-Distribution
💡Normal Distribution
💡Chi-Square Distribution
💡Sample Data
💡Rejection Region
💡Significance Level
💡Manufacturing Pencils
Highlights
The lesson focuses on conceptually understanding hypothesis testing before diving into real problems.
Hypothesis testing involves a null hypothesis and an alternative or research hypothesis.
The goal is to use sample data to either reject or fail to reject the null hypothesis.
Example scenario: testing if pencils are longer than they should be on average.
Drawing the line to determine if the average length of sampled pencils is significantly different from the expected mean.
The concept of a "hurdle" or threshold that must be surpassed to reject the null hypothesis.
Confidence intervals will be connected to hypothesis testing as they share similarities.
Different distributions (t-distribution, normal distribution, chi-square) are used for different types of confidence intervals.
The same distributions will be relevant when performing hypothesis tests on means, proportions, and variances.
The importance of taking things slower initially to build a strong foundation in hypothesis testing.
Real problem-solving using hypothesis testing will be covered in the next lesson.
The material covered is applicable for the next 10-15 lessons in the class.
The need to ensure a thorough understanding before progressing to more complex topics.
The potential consequences of a machine not working properly, as illustrated by the pencil length example.
The societal and practical implications of hypothesis testing in real-world scenarios.
The assurance that the foundational concepts will make more complex topics easier to grasp later on.
The commitment to guide students step-by-step to ensure a deep understanding of hypothesis testing.
The anticipation of the students to move on to solving real problems and the instructor's promise to address this in the subsequent lesson.
Transcripts
Browse More Related Video
Intro to Hypothesis Testing in Statistics - Hypothesis Testing Statistics Problems & Examples
Explaining The One-Sample t-Test

01 - Hypothesis Testing For Means & Large Samples, Part 1
Type 1 errors | Inferential statistics | Probability and Statistics | Khan Academy
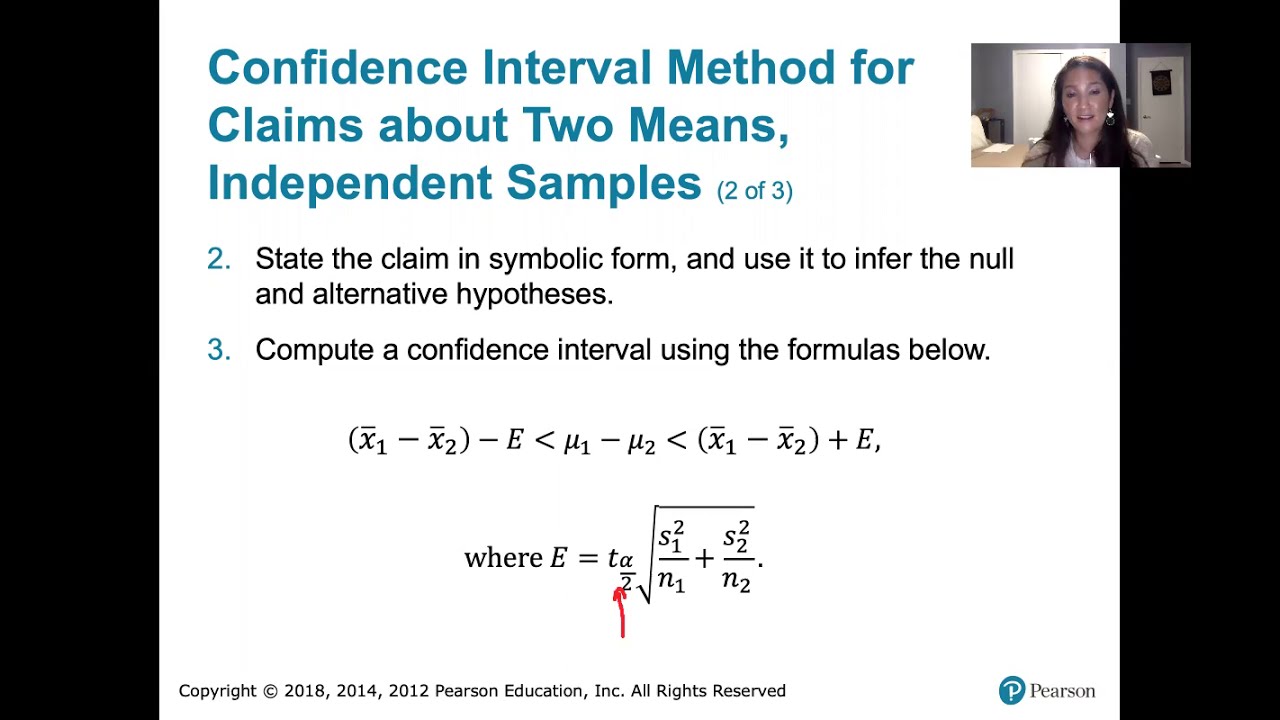
9.2.4 Two Means, Indep. Samples - Confidence Intervals, St. Deviations Unknown, Not Assumed Equal
Calculate the P-Value in Statistics - Formula to Find the P-Value in Hypothesis Testing
5.0 / 5 (0 votes)
Thanks for rating: