Teach me STATISTICS in half an hour! Seriously.
TLDRIn this engaging video, Justin Zeltzer from zstatistics.com takes on the challenge of explaining statistics in under 30 minutes. He introduces viewers to the basics of data types, including categorical and numerical data, and delves into the concepts of distributions, sampling, and estimation. Zeltzer also discusses hypothesis testing, the use of p-values, and the importance of understanding the limitations of statistical tests to avoid 'P hacking', a practice that can lead to misleading research conclusions.
Takeaways
- 📊 Introduction to statistics with a focus on developing intuition rather than mathematical computation.
- 🏀 The video uses NBA examples to make statistics more relatable and interesting.
- 📈 Data types in statistics are categorized into categorical (nominal and ordinal) and numerical (discrete and continuous).
- 🏆 Steph Curry's team and position are used as examples of categorical data, specifically nominal and ordinal categories.
- 🏀 Discrete numerical data includes countable items, like the number of free throws missed, while continuous numerical data includes measurements, like Steph Curry's height.
- 📊 Proportions and percentages are discussed as numerical data types derived from nominal data, such as the proportion of successful three-point shots.
- 📈 Distributions, like the height of NBA players, can be described using probability density functions, showing the likelihood of different outcomes.
- 🔍 Sampling distributions are used to understand the distribution of sample statistics, like the average height of a random group of NBA players.
- 🎯 The concept of a parameter (theta) is introduced as an unknown, fixed value that we estimate using sample statistics.
- 🚫 Hypothesis testing is explained with an example of testing whether Meyers Leonard's three-point shooting percentage is above 50%.
- 🔢 P-values are discussed as a measure of how extreme a sample statistic is, helping to determine if there's enough evidence to reject the null hypothesis.
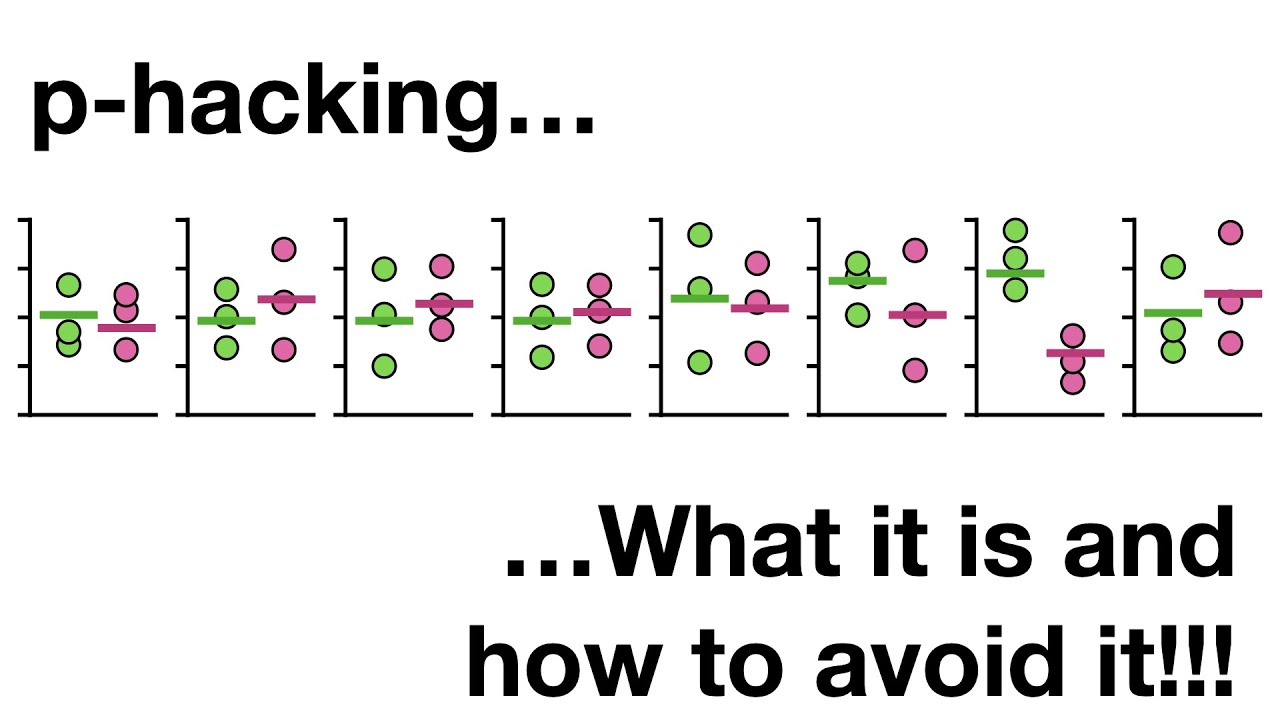
- 💡 The issue of P hacking is highlighted as a problem in scientific research, where multiple tests are conducted to find significant results without a prior hypothesis.
Q & A
What is the main challenge that Justin Zeltzer addresses in the video?
-Justin Zeltzer addresses the challenge of explaining statistics in under half an hour, aiming to provide an introduction to the subject without using mathematical jargon.
What are the two main types of data in statistics?
-The two main types of data in statistics are categorical data and numerical data.
How can categorical data be further classified?
-Categorical data can be further classified into nominal categorical data, where there is no order to the categories, and ordinal categorical data, where there is a specific order to the categories.
What is an example of nominal categorical data?
-An example of nominal categorical data is the team a basketball player like Steph Curry plays for, as there is no inherent order to the different teams.
What is an example of ordinal categorical data?
-An example of ordinal categorical data is the position a basketball player holds, such as Guard, Forward, or Center, as there is a general order to these positions based on their roles on the court.
How can numerical data be divided?
-Numerical data can be divided into discrete numerical data, which has distinct, separate values, and continuous numerical data, which can have any value within a range.
What is the difference between discrete and continuous numerical data?
-Discrete numerical data can only take specific, separate values, such as the number of free throws missed. Continuous numerical data can take any value within a range, such as a player's height to a very precise decimal.
What is a probability density function?
-A probability density function describes the distribution of a continuous variable, such as the heights of NBA players, showing the probability of selecting a player at a specific height.
What is a sampling distribution?
-A sampling distribution is the probability distribution of a sample statistic, such as the average height of a random sample of NBA players, and it becomes narrower as the sample size increases.
What is the concept of a parameter in statistics?
-A parameter is a numerical characteristic that describes a population, such as the mean (mu), standard deviation (sigma), or proportion (pi), and is an unknowable fixed value that statisticians estimate using sample statistics.
What is hypothesis testing in statistics?
-Hypothesis testing is a statistical method used to determine whether there is enough evidence in the data to suggest that a certain condition or effect is true, by comparing the sample statistic to a null hypothesis.
What is P-hacking, and why is it problematic in research?
-P-hacking is the practice of conducting multiple statistical tests on the same data set and selecting the results that show significance (usually with a p-value less than 0.05) without adjusting for the number of tests conducted. This can lead to false positives and is considered bad research practice because it increases the likelihood of finding significant results by chance.
Outlines
📚 Introduction to Statistics
Justin Zeltzer introduces the concept of statistics in a simplified manner, aiming to explain it without the use of complex math and within half an hour. He uses the NBA as a relatable context, discussing different types of data such as categorical and numerical, and further divides them into nominal, ordinal, discrete, and continuous data. The explanation includes examples related to basketball player Steph Curry to illustrate these concepts.
📊 Understanding Data Types and Distributions
The video segment delves deeper into the nuances of data types, exploring the concept of proportions and their relation to numerical data. It also discusses the idea of data distribution, using the heights of NBA players as an example to demonstrate different types of distributions like normal, uniform, bimodal, and skewed distributions. The segment aims to provide a visual understanding of how data is represented and analyzed in statistics.
🎯 Sampling Distributions and Estimation
This part of the script focuses on the concept of sampling distributions and estimation. It explains how the distribution of the average height of a sample of NBA players would differ from the distribution of individual player heights. The segment introduces the idea of reducing variance with larger sample sizes and discusses the use of sample statistics to estimate unknown parameters, represented by the Greek letter theta.
🔍 Hypothesis Testing and Confidence Intervals
The script introduces hypothesis testing, a method used to make inferences about population parameters based on sample data. It explains the concept of null and alternative hypotheses, and how they are used to determine if there is enough evidence to reject the null hypothesis. The segment also discusses confidence intervals, which provide a range of values within which the population parameter is likely to fall with a certain level of confidence.
📈 Parameters and Symbols in Statistics
This section provides an overview of common parameters used in statistics, such as mu for the mean, sigma for the standard deviation, and pi for the proportion of a categorical variable. It explains the use of Greek letters to represent these parameters and introduces other symbols used for sample statistics, like x-bar for the average height and s for standard deviation. The segment emphasizes the importance of understanding these symbols and parameters in statistical analysis.
🚫 The Pitfalls of P-Hacking
The final part of the script discusses the misuse of p-values in statistical research, a practice known as p-hacking. It explains how conducting multiple tests on the same data can lead to false positives due to the increased likelihood of extreme results by chance. The segment warns against the practice of p-hacking and emphasizes the importance of conducting research with a predefined hypothesis and testing only that specific effect to avoid misleading conclusions.
Mindmap
Keywords
💡Statistics
💡Categorical Data
💡Numerical Data
💡Sample Space
💡Probability Distribution
💡Sampling Distribution
💡Estimation
💡Confidence Interval
💡Hypothesis Testing
💡P-Value
💡P-Hacking
Highlights
Justin Zeltzer from zstatistics.com takes on the challenge of explaining statistics in under half an hour, aiming to develop intuition for those new to the subject.
The introduction to statistics is themed around the NBA, making the concepts more relatable and interesting.
Data types in statistics are categorized into categorical and numerical data, with further subdivisions into nominal, ordinal, discrete, and continuous data.
Categorical data includes nominal categories with no order, such as the teams Steph Curry could play for.
Ordinal categorical data has a loose order, like the positions in basketball, with guards, forwards, and centers.
Discrete numerical data consists of distinct, countable values, like the number of free throws missed by a player.
Continuous numerical data can have infinite decimal places, such as a player's height in centimeters.
Proportions and percentages are essentially the same, with the difference being the expression in terms of hundred or as a decimal.
Probability density functions describe the distribution of data, such as the heights of NBA players.
The normal distribution, also known as the bell curve, indicates that the bulk of the data is in the middle with fewer data points at the extremes.
Sampling distributions are used to understand the distribution of sample means, which become thinner as the sample size increases.
Statistical estimation involves using sample statistics to estimate parameters, which are the true but unknown values in a population.
Confidence intervals, such as 95% confidence intervals, provide a range within which we can be confident the true parameter lies.
Hypothesis testing is a method to determine if there's enough evidence to reject the null hypothesis, using concepts like p-values and rejection regions.
P-hacking is the misuse of p-values by testing multiple hypotheses and selecting the ones that show significance, which can lead to false conclusions.
Good research involves theorizing an effect, collecting data, and then testing that specific effect, whereas bad research involves data dredging for significant results.
The video concludes with a reminder of the importance of proper statistical methods and the potential pitfalls of misuse, such as p-hacking.
Transcripts
Browse More Related Video

T-test, ANOVA and Chi Squared test made easy.

What are p-values?? Seriously.
p-hacking: What it is and how to avoid it!

AP Statistics Unit 6 Summary Review Inference for Proportions Part 2 Significance Tests

P Value and Hypothesis Testing Simplified|P-value and Hypothesis testing concepts in Statistics
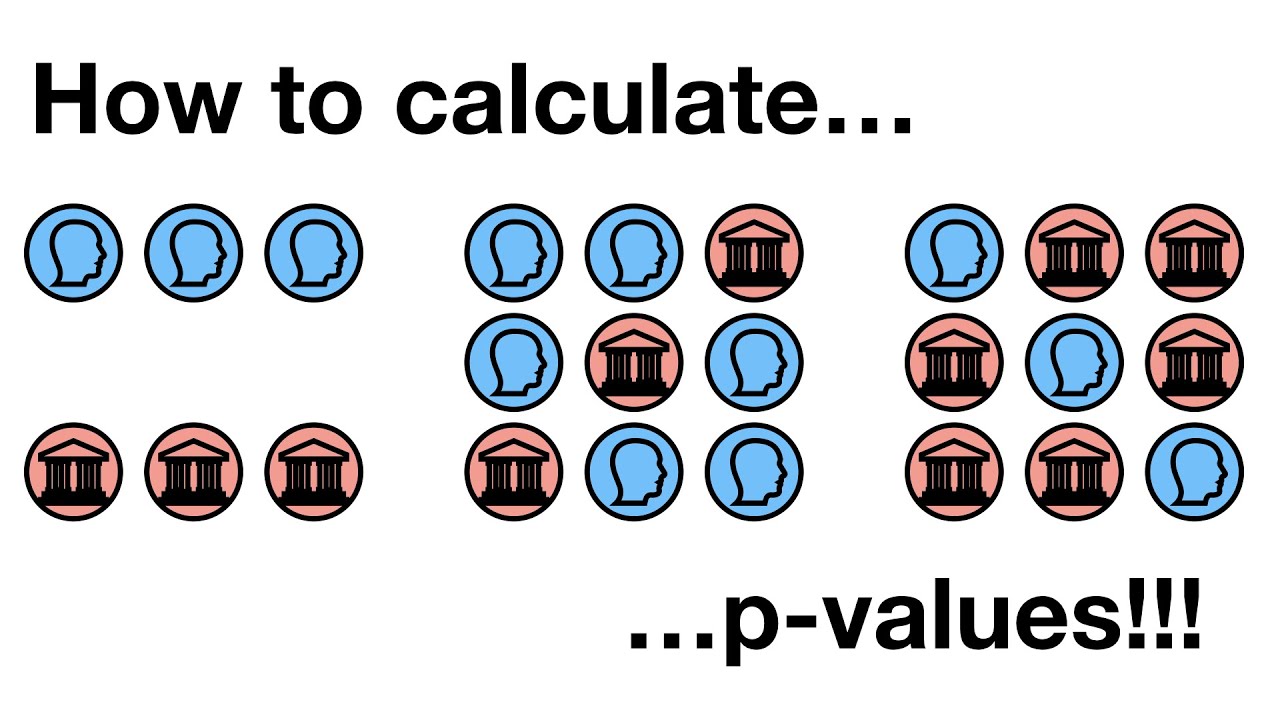
How to calculate p-values
5.0 / 5 (0 votes)
Thanks for rating: