Video 03 - Tensor Fields
TLDRThis video introduces the concept of tensor fields in a two-dimensional Euclidean space, starting with scalar fields as the simplest form of tensor fields. Scalar fields assign a scalar value to every point in space, visualized as temperature variations on a grill. The video demonstrates how scalar fields can be represented graphically using a third dimension to depict values and contour lines. It then transitions to vector fields, which assign a vector to each point, illustrating direction and magnitude, like wind velocities on a map. The presentation emphasizes the geometric nature of these fields, independent of coordinate systems, and hints at the extension to higher-rank tensor fields and their potential in higher dimensions.
Takeaways
- 📚 The video introduces the concept of tensor fields using graphing software in a two-dimensional Euclidean space.
- 🔍 A scalar field is the most basic type of tensor field, consisting of scalar values associated with every point in space.
- 📈 Scalar fields are geometric concepts and do not inherently depend on a coordinate system, although coordinates are often used for analysis.
- 🍳 An example of a scalar field is the temperature distribution on a cooking grill, where different points have different temperatures.
- 📊 Scalar fields can be visually represented using a third dimension to show scalar values at each point, creating a contour surface.
- 🗺 By slicing the three-dimensional surface with parallel planes, contour lines can be created to represent the scalar field in a map-like format.
- 🌈 Scalar fields can also be depicted using color shading, with different colors representing different scalar values.
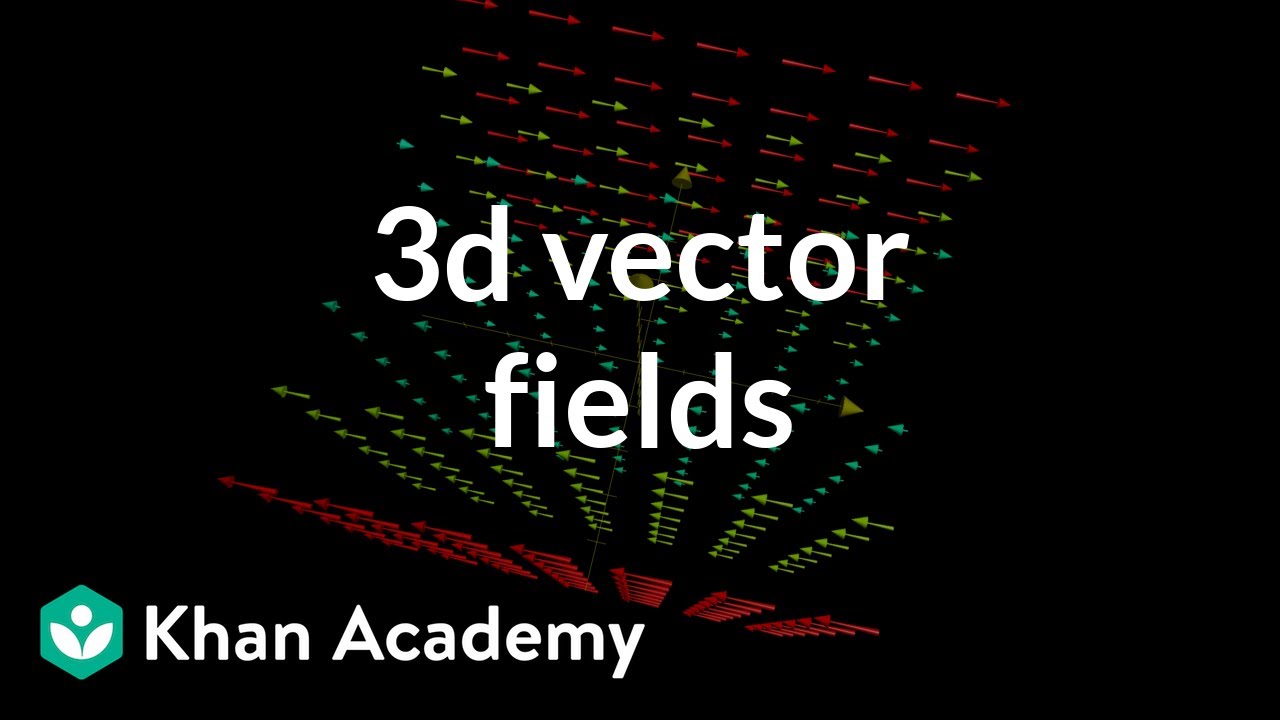
- 🚀 The video then transitions to vector fields, which associate vectors with each point in space, representing both direction and magnitude.
- 🌀 An example of a vector field is wind velocity plotted on a map, showing the direction and strength of wind at different points.
- 📐 Vector fields can be graphically depicted by placing arrows at each point, indicating the direction and magnitude of the vector at that location.
- 🌍 Both scalar and vector fields can exist in two or more dimensions, and the concept extends to higher-rank tensors with more components at each point.
- 📘 The video concludes by emphasizing that tensor fields are a generalization of the concepts introduced, applicable to spaces of any dimension.
Q & A
What is the main topic of the video?
-The main topic of the video is the introduction to tensor fields, specifically scalar and vector fields, in the context of tensor calculus.
Why does the video start with a two-dimensional Euclidean space without a coordinate system?
-The video starts with a two-dimensional Euclidean space without a coordinate system to emphasize the geometric nature of tensor fields, which exist independently of any coordinate system.
What is a scalar field and how is it represented in the video?
-A scalar field is a set of scalar values associated with each point in space. In the video, it is represented by a function that assigns a scalar value to every point in the space, and these values change as the point moves within the space.
Can you explain the analogy used in the video to describe a scalar field?
-The video uses the analogy of a cooking grill with varying temperatures to describe a scalar field. The temperature at each point on the grill represents the scalar value at that point in the field.
How does the video demonstrate the independence of scalar fields from coordinate systems?
-The video demonstrates this by showing that the scalar value at a point remains the same regardless of the coordinate system used, whether it's Cartesian, polar, or any other system.
What is the purpose of adding a third dimension to represent the scalar field in the video?
-The third dimension is added artificially to visually represent the scalar field by creating a contour surface where the height corresponds to the scalar value at each point in the x-y plane.
How are contour lines used in the video to represent the scalar field?
-Contour lines are used to represent points of equal scalar value. By slicing the three-dimensional contour surface with parallel planes and marking their intersections, contour lines are created to give a two-dimensional view of the scalar field.
What is a vector field and how does it differ from a scalar field?
-A vector field is a set of vectors associated with each point in space, where each vector has both magnitude and direction. Unlike a scalar field, which only has a magnitude at each point, a vector field also includes directional information.
How does the video represent the vectors in a vector field?
-In the video, vectors in a vector field are represented by arrows with direction and magnitude. The arrow's direction and length change as the point moves within the space, reflecting the vector's properties at that point.
What is the significance of the vector field example of wind velocities on a map?
-The wind velocities example illustrates how a vector field can represent real-world phenomena, showing the direction and magnitude of wind at different points on a map, which is a practical application of vector fields.
How does the video suggest visualizing a vector field?
-The video suggests visualizing a vector field by plotting arrows at each point in space, with each arrow representing the vector at that point. This method allows for an immediate understanding of the overall properties and organization of the vector field.
What is the potential extension of the concepts discussed in the video to higher dimensions and tensor ranks?
-The video suggests that the concepts of scalar and vector fields can be extended to higher dimensions and to tensors of rank 2, 3, 4, and so on. The main change with higher ranks is the increase in the number of components associated with each point in space.
Outlines
📚 Introduction to Tensor Fields
This paragraph introduces the concept of tensor fields through a demonstration using graphing software. The presenter explains that a tensor field is a set of values associated with each point in a space, starting with the simplest form, a scalar field. A scalar field assigns a scalar value to every point in a two-dimensional Euclidean space. The presenter emphasizes that a scalar field is a geometric concept independent of any coordinate system. To help visualize this, the idea of a cooking grill with varying temperatures is used as an analogy. The paragraph concludes with the addition of a coordinate system to the demonstration, illustrating that while a scalar field is a geometric object, coordinate systems are used for analytical convenience.
📈 Visualizing Scalar Fields with Graphs and Contours
The second paragraph delves into the visualization techniques for scalar fields. The presenter discusses using a third dimension to represent scalar values, creating a three-dimensional contour surface. This method allows for a comprehensive view of the scalar field, showing how values vary across the plane. The presenter also explains the concept of slicing this surface with parallel planes to create contour lines, akin to a topographic map. The use of color shading to represent different scalar values is mentioned as another technique for visual representation. The paragraph concludes by reinforcing the simplicity of the concept: every point in the field corresponds to a scalar value.
🌀 Understanding Vector Fields and Their Graphical Representation
In this paragraph, the focus shifts to vector fields, which are also a type of tensor field. The presenter describes how a vector field assigns a vector to every point in space, with both magnitude and direction. The graphical representation of a vector field is explained, with vectors originating from points in the space. The importance of understanding that the vector's components and magnitude are specific to the point is highlighted. An analogy of wind velocity on a map is used to illustrate the practical application of vector fields. The paragraph concludes with a discussion on how to graphically depict vector fields by plotting vectors at each point, which can reveal patterns such as sources and sinks within the field.
🔍 Extending the Concept of Tensor Fields to Higher Dimensions and Ranks
The final paragraph broadens the discussion to tensor fields in higher dimensions and ranks. The presenter explains that the principles demonstrated for scalar and vector fields in two dimensions can be extended to three dimensions or more, and to tensors of higher ranks. The paragraph emphasizes that the concept of a tensor field is a generalization of assigning values to points in space, with the only change being the number of components associated with each point. The presenter wraps up the video by stating that the next session will focus on an in-depth look at coordinate systems.
Mindmap
Keywords
💡Tensor Calculus
💡Tensor Field
💡Scalar Field
💡Vector Field
💡Euclidean Space
💡Coordinate System
💡Contour Map
💡Magnitude
💡Direction
💡Source and Sink
💡Higher-Rank Tensors
Highlights
Introduction to the concept of tensor fields using graphing software.
Demonstration of a two-dimensional Euclidean space without a coordinate system.
Explanation of a scalar field as the most elementary type of tensor field.
Description of a scalar field as a set of scalar values associated with each point in space.
Use of a scalar function to represent scalar values at points without reliance on a coordinate system.
Analogy of a scalar field to the temperature distribution on a cooking grill.
Introduction of coordinate systems for analytical purposes in scalar field representation.
Principle that scalar field values are independent of the coordinate system used.
Graphic representation techniques for scalar fields, including the use of a third dimension.
Creation of a three-dimensional contour surface to visualize scalar field values.
Technique of slicing through the contour surface to create a set of parallel planes for contour lines.
Depiction of scalar fields through contour maps and the use of color shading for value representation.
Transition to the concept of vector fields as an extension of tensor fields.
Association of every point in space with a vector in a vector field, emphasizing direction and magnitude.
Graphic representation of vector fields with arrows indicating direction and length.
Example of a vector field using wind velocities plotted on a map.
Graphic depiction of vector fields with arrows at each point, showing overall properties.
Conceptualization of scalar and vector fields in higher dimensions and higher tensor ranks.
Generalization of the idea of tensor fields beyond rank 0 and 1 to include higher ranks.
Conclusion and预告 of the next video's focus on coordinate systems.
Transcripts


5.0 / 5 (0 votes)
Thanks for rating: