AP Calculus AB - 1.1 - Can Change Occur at an Instant?
TLDRIn this AP Calculus AB video, Mr. Bortnick introduces Unit 1 on limits and continuity, focusing on the concept of change occurring at an instant. He emphasizes the importance of note-taking and provides guided notes for students to follow along. The instructor explains the geometric concepts of secant and tangent lines, relating them to functions in calculus, and discusses the slope of a line as the rate of change. He uses a real-world example involving a person's distance from home over time to illustrate the calculation of average and instantaneous rates of change, encouraging students to practice and check their understanding with posted problems and solutions.
Takeaways
- 📚 The video is an AP Calculus AB lesson focusing on the first unit about limits and continuity, specifically discussing the concept of change occurring at an instant (1.1).
- 📝 Mr. Bortnick emphasizes the importance of taking notes during the video, suggesting the use of a dedicated AP calculus notebook and guided notes provided for the course.
- 🖨️ The instructor mentions the availability of downloadable guided notes for students to follow along, with or without a printer, and encourages writing down questions for clarification during live class time.
- 📧 Students are encouraged to email the instructor with questions using their school email addresses, and the instructor will address these during live sessions or via email.
- 📈 The lesson introduces geometric concepts like secant and tangent lines and relates them to functions in calculus to explain the idea of change at a point.
- 🔍 The video uses the analogy of a circle's secant and tangent lines to explain the concept of secant and tangent lines in the context of functions, which is foundational for understanding calculus.
- 📉 Mr. Bortnick discusses the concept of slope in the context of linear functions and how it translates to the rate of change in calculus, using function notation.
- ✍️ The script walks through an example problem involving Mr. Brust's distance from his house modeled by a function 'd(t)', illustrating how to calculate average speed and rate of change.
- 📊 The lesson differentiates between average rate of change over a time interval and instantaneous rate of change at a specific point, using the slope of a tangent line as an example.
- 📚 The instructor provides a step-by-step guide on how to estimate the instantaneous rate of change by using points very close to the specific time of interest.
- 📝 The video concludes with an example involving the buffalo population over time, demonstrating how to calculate the average increase per year and estimate the instantaneous rate of change at a specific year.
Q & A
What is the main topic of the first video in the AP Calculus AB series?
-The main topic of the first video is limits and continuity, specifically discussing whether change can occur at an instant, which is covered in Unit 1, Topic 1.1.
Why is it important to take notes while watching the video?
-Taking notes is important as the videos serve as the primary source of notes for the section. It helps in collecting and reviewing the material, and aids in understanding the concepts discussed in the video.
What is the purpose of the guided notes provided with the video?
-The guided notes are meant to assist students in following along with the problems discussed in the video. They can be downloaded and used as a reference while taking notes or working through the problems.
How can students engage with the instructor if they have questions about the material?
-Students can write down their questions during the video and bring them up during live class time for clarification. Alternatively, they can email the instructor using their school email address.
What is the significance of the mastery check after completing the video and practice problems?
-The mastery check serves as a graded assessment to determine whether the student has understood the material. It provides a way to measure comprehension and identify areas that may require further study.
What is the relationship between the concepts of secant lines and tangent lines in geometry and their application to functions in calculus?
-In geometry, secant lines intersect a circle at two points, while tangent lines touch the circle at exactly one point. In calculus, similar concepts apply to functions where secant lines represent the average rate of change over an interval, and tangent lines represent the instantaneous rate of change at a specific point.
How is the slope of a linear function related to the concept of rate of change in calculus?
-The slope of a linear function, represented as 'm' in the equation y = mx + b, is the rise over run, which is the change in y values over the change in x values. In calculus, the rate of change or average speed is calculated using a similar formula, f(b) - f(a) / (b - a), where 'f' represents the function.
What does the function d(t) represent in the context of the problem involving Mr. Brust's bike ride?
-The function d(t) represents the distance Mr. Brust is from his house at a given time 't' during his bike ride to the store and back.
How can you estimate the instantaneous rate of change at a specific time, such as t=2, using the information from the video?
-To estimate the instantaneous rate of change at t=2, you can calculate the average rate of change between t=2 and a value very close to 2, such as t=2.001. The closer the second time value is to 2, the better the estimate of the instantaneous rate of change.
What does the value b(90) represent in the context of the buffalo population problem?
-The value b(90) represents the buffalo population in the United States in the year 1890, which is 90 years after 1800.
How does the expression b(50) - b(0) / (50 - 0) relate to the buffalo population problem?
-The expression b(50) - b(0) / (50 - 0) represents the average increase in the buffalo population per year between 1800 and 1850, indicating the rate of change in the population over that period.
What is the significance of the two time values t=32 and t=31.999 in the buffalo population problem?
-The two time values t=32 and t=31.999 are used to estimate the instantaneous rate of change in the buffalo population in the year 1832. The closer the two values are, the more accurate the estimate of the instantaneous rate of change.
Outlines
📚 Introduction to AP Calculus AB Unit 1
Mr. Bortnick introduces the first unit of AP Calculus AB, focusing on limits and continuity. He emphasizes the importance of taking notes and suggests using the provided guided notes. He also encourages students to write questions as they watch and to bring them to live class for clarification. Additionally, he mentions the availability of practice problems and solutions, as well as a mastery check to assess understanding.
📐 Understanding Secant and Tangent Lines in Functions
The script explores the concepts of secant and tangent lines in the context of functions, drawing parallels to geometry. It explains that just as a secant line intersects a circle at two points, a similar concept applies to functions. The tangent line, which touches a curve at a single point, is also discussed. The importance of these concepts in calculus is highlighted.
🔍 Transitioning from Algebra to Calculus with Slope
The video script transitions from algebra to calculus by discussing the concept of slope. It reviews the slope formula from algebra, which is the change in y-values over the change in x-values, and applies this concept to functions in calculus. The slope of a function at two points is calculated using the difference in function values at those points divided by the difference in their x-values.
🚴♂️ Analyzing Average Speed with a Real-World Example
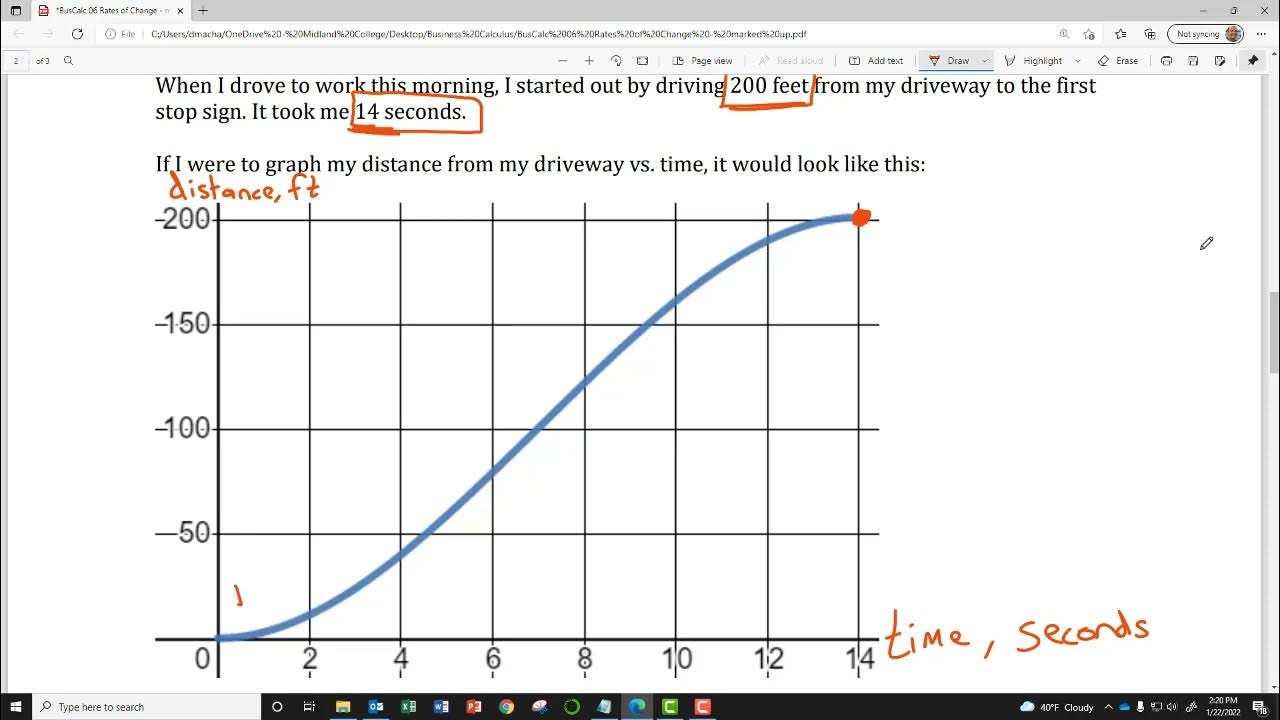
The script presents a problem involving Mr. Brust's distance from his house modeled by a function 'd(t)'. It uses a graph to illustrate his journey to the store, including the point where he realizes he dropped his wallet and turns back. The average speed, or rate of change, is calculated for the entire trip and for specific intervals, using the slope formula.
🐃 Buffalo Population Dynamics and Instantaneous Rate of Change
The script discusses a function 'b(t)' representing the buffalo population in the United States over time since 1800. It explains what 'b(90)' signifies and how to calculate the average increase in buffalo population per year between 1800 and 1850. The concept of instantaneous rate of change is introduced, using values very close to 't=32' to estimate the exact rate of change in 1832.
Mindmap
Keywords
💡AP Calculus AB
💡Limits
💡Continuity
💡Secant Line
💡Tangent Line
💡Slope
💡Function Notation
💡Average Rate of Change
💡Instantaneous Rate of Change
💡Mastery Check
💡Guided Notes
Highlights
Introduction to AP Calculus AB Unit 1 on limits and continuity.
Emphasis on note-taking as an essential part of learning, with the video serving as a guide.
Availability of guided notes for download to assist with note-taking.
Encouragement to write down questions during the video for clarification in live class sessions.
Instructions on using the posted packet for practice and checking understanding with provided solutions.
Introduction of mastery checks as a graded component to assess understanding of the lesson.
Linking geometry concepts such as secant and tangent lines to calculus functions.
Explanation of the difference between secant and tangent lines in the context of functions.
Connection between algebraic concepts of slope and calculus functions using function notation.
Illustration of how to calculate the slope of a function using the formula f(b) - f(a) / (b - a).
Use of a real-world example involving Mr. Brust's bike ride to explain average speed and rate of change.
Calculation of average speed over the entire trip and specific time intervals using the slope formula.
Discussion on the possibility of estimating instantaneous rate of change using close time points.
Visual estimation of instantaneous rate of change from a graph as an example.
Application of calculus concepts to the buffalo population over time in the United States.
Explanation of how to represent the buffalo population in a specific year using the function notation b(t).
Calculation of the average increase in buffalo population per year between 1800 and 1850.
Estimation of the instantaneous rate of change in buffalo population in 1832 using close time values.
Transcripts
5.0 / 5 (0 votes)
Thanks for rating:


