Worked example: Inflection points from first derivative | AP Calculus AB | Khan Academy
TLDRThe video script discusses finding the x-value of the left-most inflection point of a differentiable function g, defined over the interval from -6 to 6. The focus is on the graph of g', the derivative of g, to determine where g changes concavity. Inflection points occur where the second derivative, g'', switches signs, indicating the first derivative, g', transitions from increasing to decreasing or vice versa. By analyzing the graph of g', the script identifies points where g' changes from increasing to decreasing and vice versa, visually pinpointing inflection points at x = -3, -1, 2, and 4. The left-most inflection point, at x = -3, is the answer to the question posed in the script.
Takeaways
- 📚 The script discusses a differentiable function g defined over the interval from -6 to 6.
- 📈 The graph provided is not of g, but of its derivative, g'.
- 🔍 The task is to find the x-value of the left-most inflection point in the graph of g, not g'.
- 📝 Inflection points are where the concavity of the graph changes, indicated by the second derivative, g''.
- 📉 A positive second derivative (g'') indicates an increasing first derivative (g'), suggesting concave up behavior.
- 📈 The first derivative (g') is analyzed for points where it switches from increasing to decreasing, which corresponds to a change from concave up to concave down.
- 🔄 The second derivative (g'') also changes signs, indicating potential inflection points where it goes from negative to positive.
- 👀 The visual analysis of g' identifies points where it transitions from increasing to decreasing and vice versa.
- 📌 Identified inflection points in the graph of g' are at x = -3, x = -1, x = 2, and x = 4.
- 🏁 The left-most inflection point, as requested, is at x = -3.
Q & A
What is the main topic discussed in the script?
-The script discusses the concept of finding the x-value of the left-most inflection point in the graph of a function g, given the graph of its derivative, g'.
What is the difference between the graph of g and g'?
-The graph of g represents the original function, while the graph of g' represents the derivative of g, which shows the rate of change of g.
Why are we not interested in the inflection points of g'?
-The inflection points of g' are not of interest because the question specifically asks for the inflection points in the graph of g, not g'.
What is an inflection point in the context of a graph?
-An inflection point is a point on the graph where the concavity changes, meaning the second derivative changes sign from positive to negative or vice versa.
How does the second derivative, g'', relate to the first derivative, g', and the original function, g?
-The second derivative, g'', is the derivative of the first derivative, g'. It indicates whether the first derivative is increasing or decreasing, and by extension, whether the original function g is concave up or concave down.
What does it mean for the first derivative to go from increasing to decreasing?
-If the first derivative, g', goes from increasing to decreasing, it means that the rate at which the original function g is increasing is itself slowing down.
What does it mean for the second derivative to be positive?
-A positive second derivative, g'', indicates that the first derivative, g', is increasing, which means the slope of the original function g is getting steeper.
How can we visually determine the inflection points from the graph of g'?
-We can visually determine the inflection points by looking for points where g' changes from increasing to decreasing or vice versa, as these correspond to the second derivative, g'', changing signs.
What are the x-values of the inflection points mentioned in the script?
-The x-values of the inflection points mentioned are -3, -1, 2, and 4.
Which x-value corresponds to the left-most inflection point in the graph of g?
-The left-most inflection point in the graph of g corresponds to the x-value of -3.
What is the significance of identifying the left-most inflection point in this context?
-Identifying the left-most inflection point helps in understanding the behavior of the original function g at the extreme left of the given interval, which can be important for various mathematical analyses and applications.
Outlines
📚 Understanding Inflection Points from the Derivative Graph
The video script begins with an explanation of a mathematical concept. It introduces a differentiable function 'g' defined over the interval from -6 to 6. The focus is on determining the x-value of the left-most inflection point of the function 'g', not its derivative 'g prime'. The script clarifies that an inflection point is where the second derivative (g prime prime) changes sign, indicating a change from concave up to concave down or vice versa. The explanation outlines the behavior of the first and second derivatives at these points. The visual analysis of the graph of 'g prime' is used to identify points where the first derivative changes from increasing to decreasing or vice versa, which correspond to the inflection points of 'g'. The left-most inflection point is identified as x equals negative three.
Mindmap
Keywords
💡Differentiable function
💡Closed interval
💡Derivative
💡Graph
💡Inflection point
💡Second derivative
💡Concavity
💡Increasing/decreasing
💡Signs
💡Visual analysis
💡X-value
Highlights
The function g is differentiable over the closed interval from negative six to six.
The graph of the derivative of g, g prime, is provided.
The task is to find the x value of the left-most inflection point in the graph of g.
Inflection points are where the second derivative changes signs.
The second derivative, g prime prime, indicates concavity changes.
When g prime prime goes from positive to negative, g prime is increasing to decreasing.
During this transition, the function g changes from concave upwards to concave downwards.
Focusing on the graph of g prime to identify inflection points in g.
G prime increases, then decreases, indicating a potential inflection point in g.
The process involves identifying points where g prime changes from increasing to decreasing and vice versa.
Two specific points where g prime transitions from increasing to decreasing are identified.
Another scenario is g prime going from decreasing to increasing, indicating a potential inflection point.
Visual analysis of the graph leads to the identification of several potential inflection points.
The left-most inflection point is determined to be at x equals negative three.
Other x values identified as inflection points are negative one, two, and four.
The task specifically asks for the left-most inflection point in the graph of g.
Transcripts
Browse More Related Video
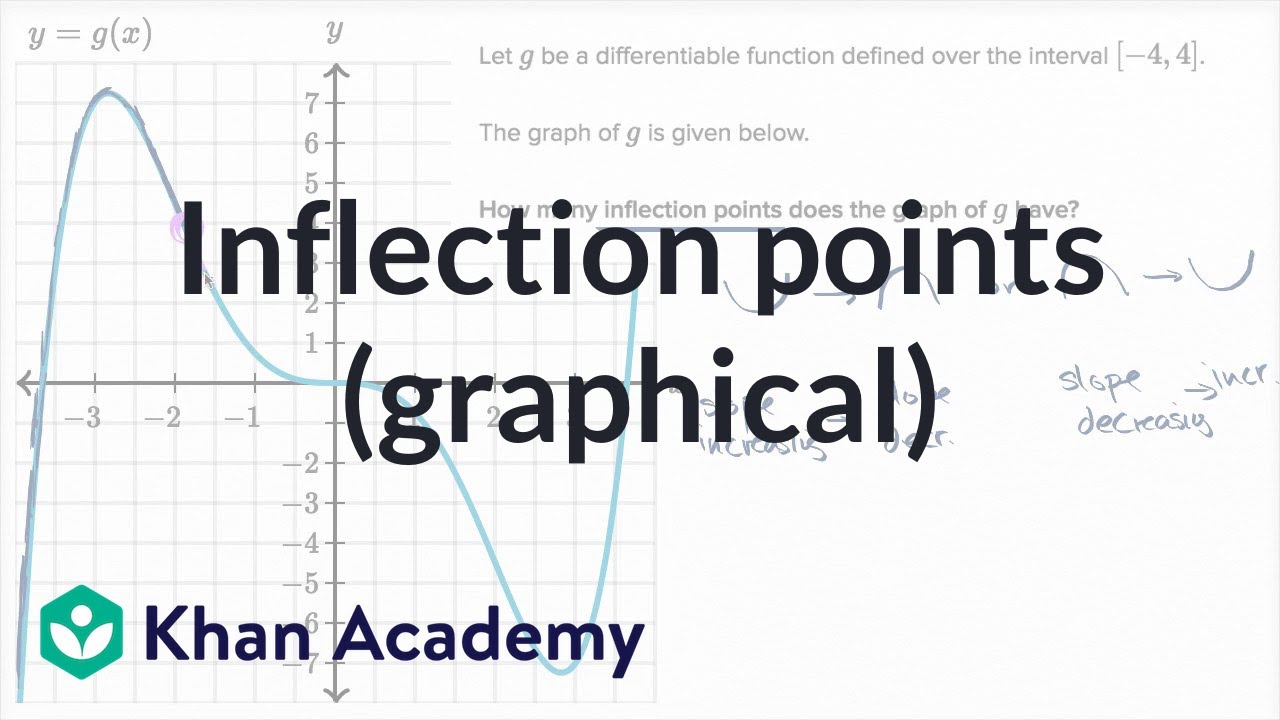
Inflection points (graphical) | AP Calculus AB | Khan Academy
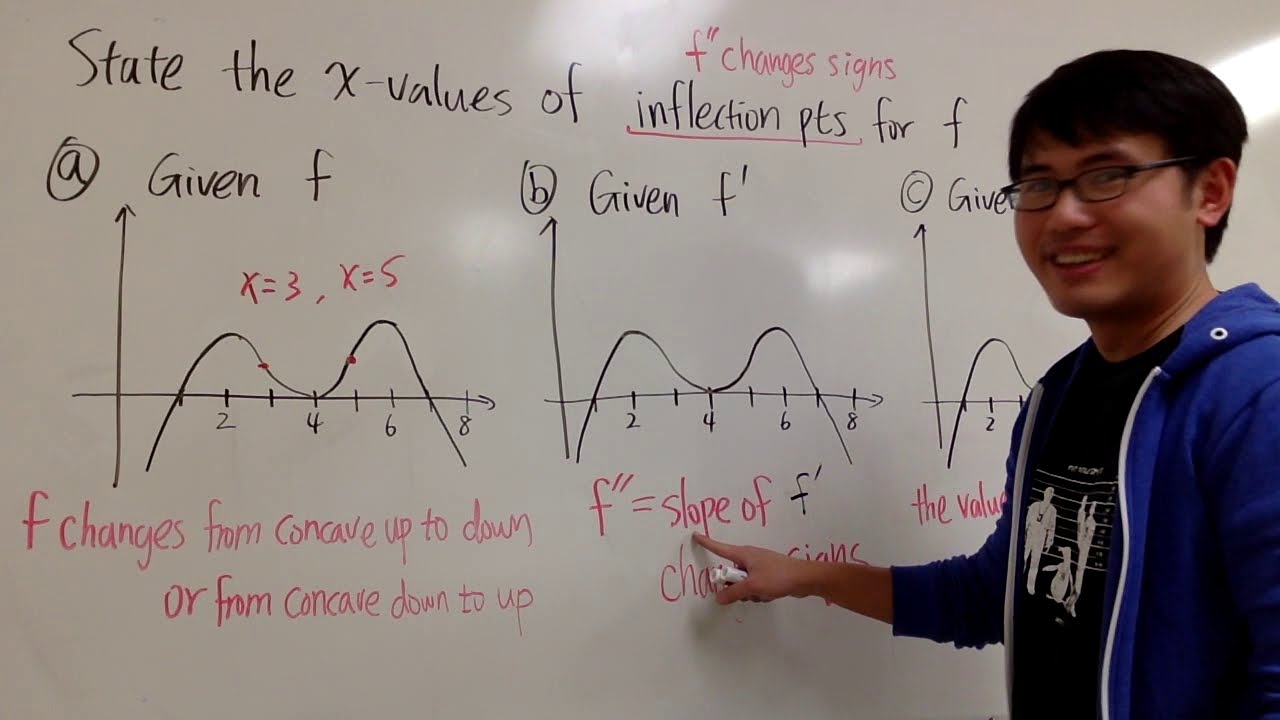
Points of inflection from the graphs of f, f' or f''
2022 AP Calculus AB BC Free Response #3
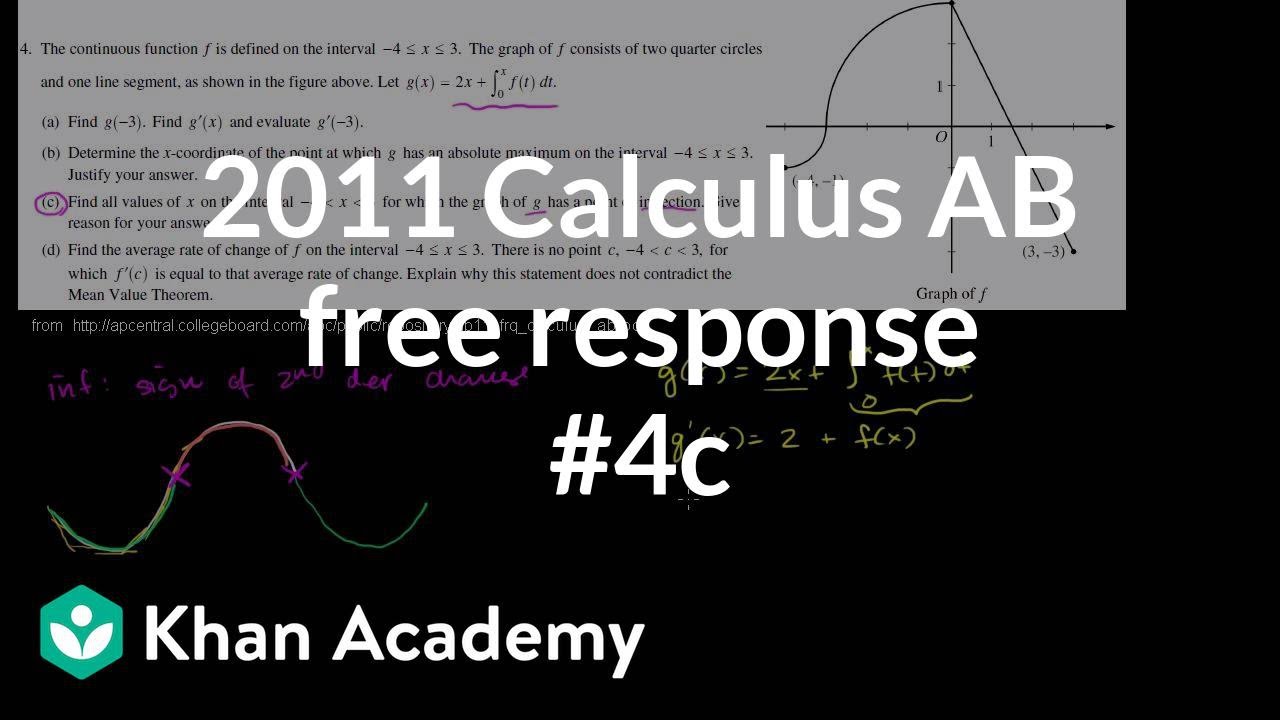
2011 Calculus AB free response #4c | AP Calculus AB | Khan Academy
2010 AP Calculus AB Free Response #5
Mistakes when finding inflection points: second derivative undefined | AP Calculus AB | Khan Academy
5.0 / 5 (0 votes)
Thanks for rating: