Standard Error of the Estimate used in Regression Analysis (Mean Square Error)
TLDRThis tutorial explains the concept of standard error of the estimate in regression analysis. It demonstrates how to calculate the standard error by comparing estimated values to actual values, squaring the differences, summing them, dividing by the number of observations minus two, and taking the square root. The example provided walks through the process step by step, emphasizing the goal of minimizing the errors between actual and estimated values. The video also distinguishes between standard error and R-squared, highlighting their roles in assessing the fit of a regression model.
Takeaways
- 📊 The tutorial focuses on explaining the concept of the standard error of the estimate in regression analysis.
- 📈 The standard error of the estimate is calculated by comparing estimated values derived from a regression line to the actual values.
- 🔢 The formula for standard error involves squaring the differences between estimated and actual values, summing them, and then dividing by the number of observations minus 2.
- 📝 The process involves taking the difference between each estimated and actual value, squaring these differences, and summing them up.
- 🧮 The sum of squared differences is then divided by the degrees of freedom, which is the number of observations minus 2.
- 🌐 The final step is to take the square root of the result from the previous step to obtain the standard error of the estimate.
- 📉 The goal of calculating the standard error is to minimize the errors or distances between the actual and estimated values.
- 📋 The script provides a step-by-step example using specific numbers to demonstrate the calculation process.
- 🔍 The standard error of the estimate is a measure of the average distance that data points fall from the regression line.
- 📊 The tutorial distinguishes between the standard error of the estimate and R-squared, which measures the proportion of variance in the dependent variable that is predictable from the independent variable(s).
- 📚 The video is part of a larger playlist, suggesting further resources for those interested in delving deeper into regression analysis.
Q & A
What is the standard error of the estimate?
-The standard error of the estimate is a measure of the average distance that the observed values fall from the regression line. It is calculated by taking the difference between the estimated and actual values, squaring these differences, summing them up, dividing by the number of observations minus 2, and then taking the square root of the result.
How do you calculate the estimated values in a regression analysis?
-Estimated values are calculated using the regression line formula, which is derived from the data points in the dataset. The formula typically involves the slope and y-intercept of the line, which are determined during the regression analysis process.
What is the purpose of comparing estimated values to actual values in regression analysis?
-Comparing estimated values to actual values helps to determine the accuracy of the regression model. The goal is to minimize the errors, which are the differences between the estimated and actual values, to ensure the model provides a good fit for the data.
Why is it important to minimize the errors in regression analysis?
-Minimizing the errors is crucial because it indicates how well the regression model predicts the actual values. Smaller errors suggest a more reliable and accurate model, which is essential for making accurate predictions or inferences.
How does the formula for calculating the standard error of the estimate differ from the formula for calculating R-squared?
-While both the standard error of the estimate and R-squared measure the fit of a regression model, the standard error compares the distance between the estimated and actual values, whereas R-squared compares the distance between the actual values and the mean, with the estimated values to the mean.
What is the significance of squaring the differences between estimated and actual values in the calculation of the standard error?
-Squaring the differences eliminates the effect of positive and negative errors cancelling each other out, ensuring that all deviations are accounted for equally. This step is crucial for accurately calculating the standard error.
What is the 'n' in the formula for the standard error of the estimate?
-The 'n' in the formula represents the number of observations in the dataset. It is used as the denominator in the calculation after subtracting 2, which accounts for the degrees of freedom in the regression model.
How does the standard error of the estimate relate to the reliability of a regression model?
-A lower standard error of the estimate indicates that the data points are closer to the regression line, suggesting a more reliable model. Conversely, a higher standard error suggests greater variability and less reliability in the model's predictions.
What is the role of the square root in the calculation of the standard error of the estimate?
-The square root is used to convert the sum of squared differences into a measure of average distance, which is easier to interpret and compare across different datasets or models.
Can the standard error of the estimate be negative?
-No, the standard error of the estimate is always a non-negative value because it is derived from the square root of the sum of squared differences, which inherently cannot be negative.
Why is it necessary to divide by 'n-2' instead of 'n' in the standard error formula?
-Dividing by 'n-2' instead of 'n' is a statistical adjustment that accounts for the fact that two parameters (the slope and y-intercept of the regression line) are estimated from the data, thus reducing the degrees of freedom in the calculation.
Outlines
📊 Understanding Standard Error of Estimate
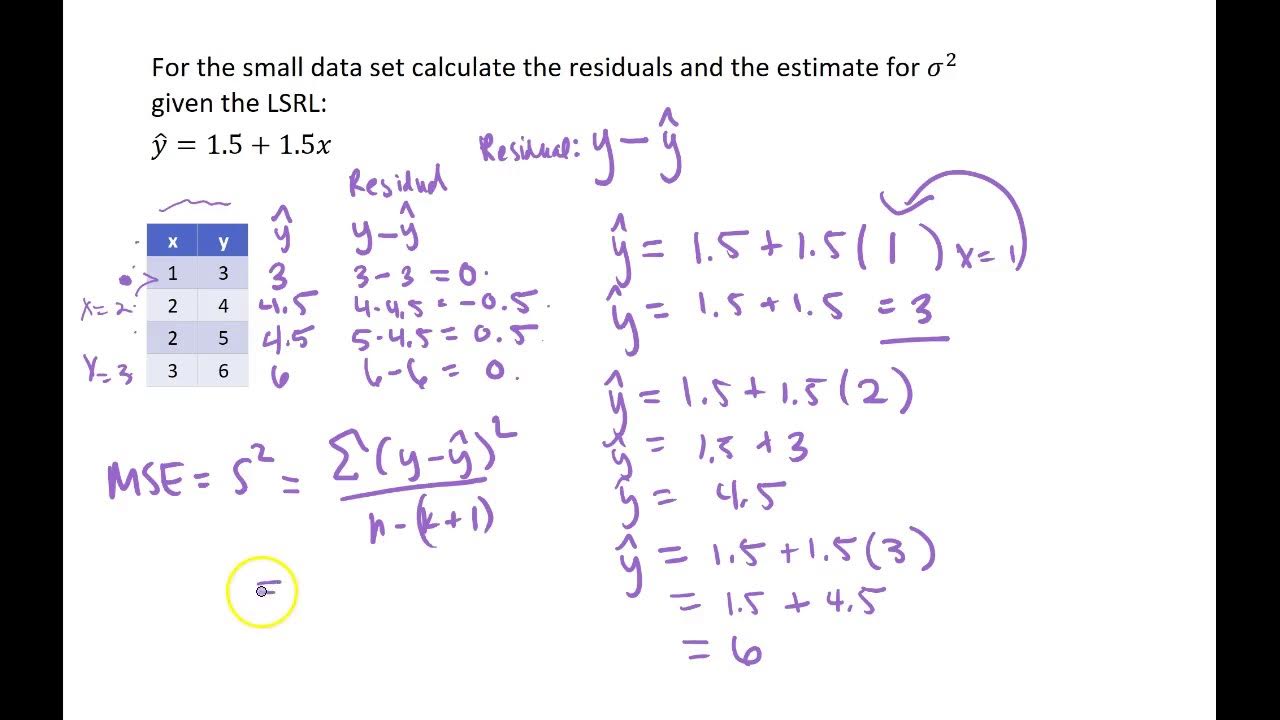
This paragraph introduces the concept of standard error of the estimate in regression analysis. The speaker explains the process of comparing actual values with estimated values derived from a regression line. The goal is to minimize the errors, which are the differences between these two sets of values. The formula for calculating the standard error is presented, involving squaring the differences, summing them, dividing by the number of observations minus two, and then taking the square root. A step-by-step example is given, demonstrating the calculation with actual numbers, resulting in a standard error of 0.89. The paragraph concludes by differentiating standard error from R-squared, which measures the variance between actual values and the mean, as opposed to the variance between estimated values and the mean.
Mindmap
Keywords
💡Standard Error of the Estimate
💡Regression Line
💡Estimated Values
💡Actual Values
💡Errors
💡Minimizing Errors
💡Observations
💡R-squared
💡Mean
💡Scatter Plot
💡Least Squares
Highlights
Introduction to the concept of standard error of the estimate in regression analysis.
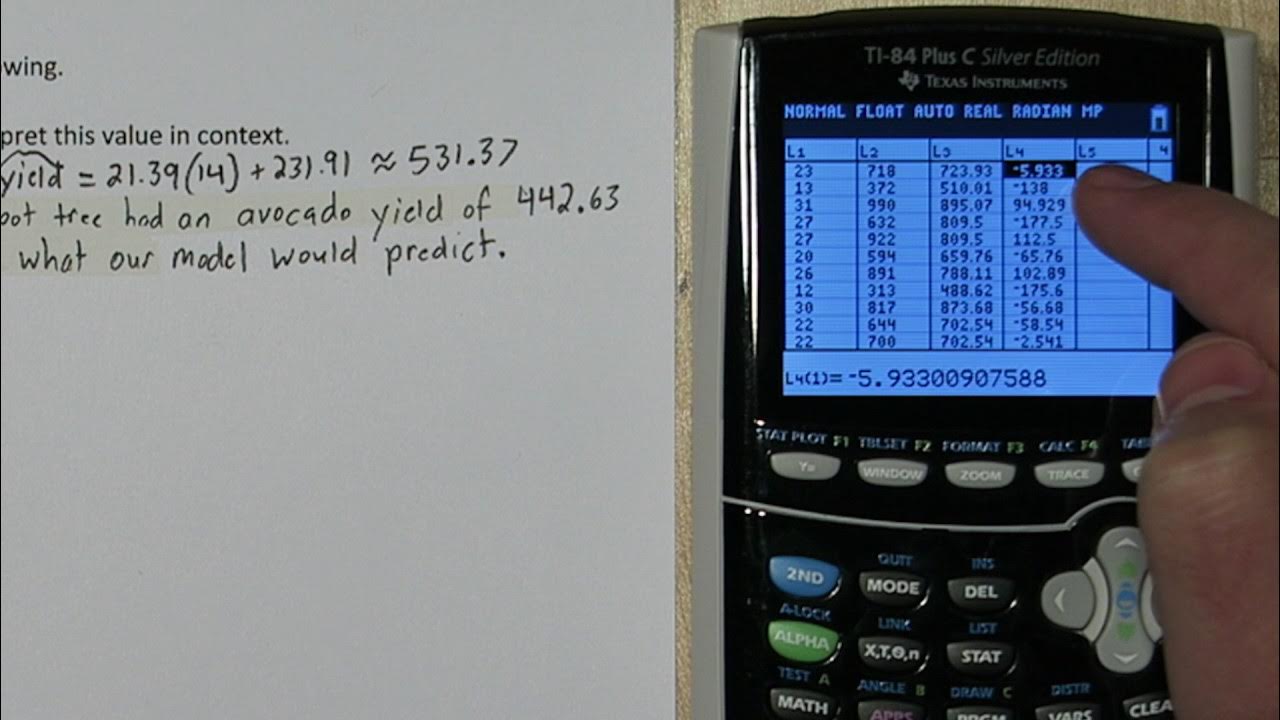
Explanation of how to calculate estimated values using a regression line.
Comparing estimated values to actual values to determine errors.
Visual representation of actual (green) and estimated (brown) values.
Objective of minimizing the distance between estimated and actual values.
Formula for calculating the standard error of the estimate.
Step-by-step calculation of the standard error using an example.
Demonstration of squaring the differences between estimated and actual values.
Summation of squared errors to find the numerator for the standard error formula.
Division by (n-2) to adjust for the number of observations.
Taking the square root of the result to find the standard error.
Final calculation result of the standard error being 0.89.
Comparison of standard error with R-squared in terms of their function in regression analysis.
Clarification on the difference between the standard error and R-squared.
Encouragement to watch the entire playlist for a comprehensive understanding.
Emphasis on the practical applications of the standard error in statistical analysis.
Highlight of the tutorial's contribution to the larger discussion on regression analysis.
Transcripts
Browse More Related Video


5.0 / 5 (0 votes)
Thanks for rating: